Toyota 2008 Annual Report Download - page 96
Download and view the complete annual report
Please find page 96 of the 2008 Toyota annual report below. You can navigate through the pages in the report by either clicking on the pages listed below, or by using the keyword search tool below to find specific information within the annual report.-
 1
1 -
2
-
3
-
4
-
5
-
6
-
7
-
8
-
9
-
10
-
11
-
12
-
13
-
14
-
15
-
16
-
17
-
18
-
19
-
20
-
21
-
22
-
23
-
24
-
25
-
26
-
27
-
28
-
29
-
30
-
31
-
32
-
33
-
34
-
35
-
36
-
37
-
38
-
39
-
40
-
41
-
42
-
43
-
44
-
45
-
46
-
47
-
48
-
49
-
50
-
51
-
52
-
53
-
54
-
55
-
56
-
57
-
58
-
59
-
60
-
61
-
62
-
63
-
64
-
65
-
66
-
67
-
68
-
69
-
70
-
71
-
72
-
73
-
74
-
75
-
76
-
77
-
78
-
79
-
80
-
81
-
82
-
83
-
84
-
85
-
 86
86 -
 87
87 -
 88
88 -
 89
89 -
 90
90 -
 91
91 -
 92
92 -
 93
93 -
 94
94 -
 95
95 -
 96
96 -
 97
97 -
 98
98 -
 99
99 -
 100
100 -
 101
101 -
 102
102 -
 103
103 -
 104
104 -
 105
105 -
 106
106 -
107
-
108
-
109
-
110
-
111
-
112
-
113
-
114
-
115
-
116
-
117
-
118
-
119
-
120
-
121
-
122
-
123
-
124
-
125
-
126
-
127
-
128
-
129
-
130
-
131
-
132
-
133
-
134
-
135
-
136
-
137
-
138
 |
 |

94 TOYOTA •Annual Report 2008 •
Financial Section
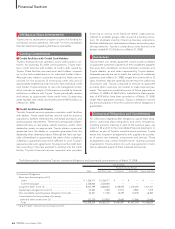
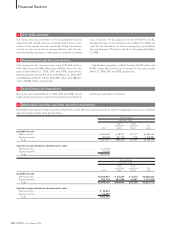
Consolidated Statements of Income
Toyota Motor Corporation
For the years ended March 31, 2006, 2007 and 2008
U.S. dollars
Yen in millions in millions
2006 2007 2008 2008
Net revenues
Sales of products .................................................................... ¥20,059,493 ¥22,670,097 ¥24,820,510 $247,734
Financing operations.............................................................. 977,416 1,277,994 1,468,730 14,660
21,036,909 23,948,091 26,289,240 262,394
Costs and expenses
Cost of products sold............................................................. 16,335,312 18,356,255 20,452,338 204,135
Cost of financing operations ................................................. 609,632 872,138 1,068,015 10,660
Selling, general and administrative....................................... 2,213,623 2,481,015 2,498,512 24,938
19,158,567 21,709,408 24,018,865 239,733
Operating income..................................................................... 1,878,342 2,238,683 2,270,375 22,661
Other income (expense)
Interest and dividend income................................................ 93,970 131,939 165,676 1,654
Interest expense ..................................................................... (21,601) (49,326) (46,113) (460)
Foreign exchange gain, net................................................... 10,789 33,005 9,172 91
Other income, net .................................................................. 125,860 28,215 38,112 380
209,018 143,833 166,847 1,665
Income before income taxes, minority interest and
equity in earnings of affiliated companies......................... 2,087,360 2,382,516 2,437,222 24,326
Provision for income taxes...................................................... 795,153 898,312 911,495 9,098
Income before minority interest and equity
in earnings of affiliated companies ..................................... 1,292,207 1,484,204 1,525,727 15,228
Minority interest in consolidated subsidiaries..................... (84,393) (49,687) (77,962) (778)
Equity in earnings of affiliated companies........................... 164,366 209,515 270,114 2,696
Net income........................................................................ ¥ 1,372,180 ¥ 1,644,032 ¥1,717,879 $ 17,146
Yen U.S. dollars
Net income per share
—Basic..................................................................................... ¥421.76 ¥512.09 ¥540.65 $5.40
—Diluted ................................................................................. ¥421.62 ¥511.80 ¥540.44 $5.39
Cash dividends per share ........................................................ ¥ 90.00 ¥120.00 ¥140.00 $1.40
The accompanying notes are an integral part of these consolidated financial statements.