Toyota 2008 Annual Report Download - page 18
Download and view the complete annual report
Please find page 18 of the 2008 Toyota annual report below. You can navigate through the pages in the report by either clicking on the pages listed below, or by using the keyword search tool below to find specific information within the annual report.-
 1
1 -
2
-
3
-
4
-
5
-
6
-
7
-
 8
8 -
 9
9 -
 10
10 -
 11
11 -
 12
12 -
 13
13 -
 14
14 -
 15
15 -
 16
16 -
 17
17 -
 18
18 -
 19
19 -
 20
20 -
 21
21 -
 22
22 -
 23
23 -
 24
24 -
 25
25 -
 26
26 -
 27
27 -
 28
28 -
29
-
30
-
31
-
32
-
33
-
34
-
35
-
36
-
37
-
38
-
39
-
40
-
41
-
42
-
43
-
44
-
45
-
46
-
47
-
48
-
49
-
50
-
51
-
52
-
53
-
54
-
55
-
56
-
57
-
58
-
59
-
60
-
61
-
62
-
63
-
64
-
65
-
66
-
67
-
68
-
69
-
70
-
71
-
72
-
73
-
74
-
75
-
76
-
77
-
78
-
79
-
80
-
81
-
82
-
83
-
84
-
85
-
86
-
87
-
88
-
89
-
90
-
91
-
92
-
93
-
94
-
95
-
96
-
97
-
98
-
99
-
100
-
101
-
102
-
103
-
104
-
105
-
106
-
107
-
108
-
109
-
110
-
111
-
112
-
113
-
114
-
115
-
116
-
117
-
118
-
119
-
120
-
121
-
122
-
123
-
124
-
125
-
126
-
127
-
128
-
129
-
130
-
131
-
132
-
133
-
134
-
135
-
136
-
137
-
138
 |
 |
16 TOYOTA •Annual Report 2008 •
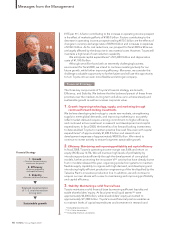
Messages from the Management
1. Performance Overview
In fiscal 2008, ended March 31, 2008, Toyota posted significant business
results. On a consolidated basis, we recorded a year-on-year increase in
vehicle sales of 389,000 units, to 8,913,000 units; a 9.8% increase in net
revenues, to ¥26,289.2 billion; a 1.4% increase in operating income, to
¥2,270.3 billion; and a 4.5% increase in net income, to ¥1,717.8 billion.
Factors contributing to the increase in operating income totaling ¥410.0
billion were the effects of marketing efforts of ¥290.0 billion and cost
reduction efforts of ¥120.0 billion. On the other hand, factors resulting in
the decrease in operating income totaling ¥378.3 billion were increases in
expenses of ¥330.2 billion and an increase in valuation losses on interest rate
swaps stated at fair value by ¥48.1 billion. Moreover, net income increased
¥73.8 billion compared with the last fiscal year, mainly due to a ¥60.6 billion
increase in equity in earnings of affiliated companies.
In fiscal 2008, Toyota’s profit structure became more geographically
balanced, due to growing contributions from resource-rich and emerging
countries in Asia, Central and South America, Oceania, and Africa. I believe
this can be attributed to Toyota’s growth strategy of utilizing every
opportunity across its full product lineup and in all regions.
Furthermore, the steady growth of net income—the ultimate profit of
Toyota’s business—is also a significant point for fiscal 2008, and is the result
of rising operating income from our global operations and equity in earnings
of affiliated companies. Growth of equity in earnings has been particularly
strong and has more than doubled over the past four years, primarily due
to the rapid growth of Chinese operations.
Moving forward, Toyota will continue to build a rock-solid base through
improvements in technology, supply, and marketing and their supporting
factors, such as product quality, cost, and human resources. Though these
efforts and by taking advantage of opportunities, while avoiding or
absorbing risks, in all product segments and regions, Toyota will continue
to pursue stable, long-term growth.
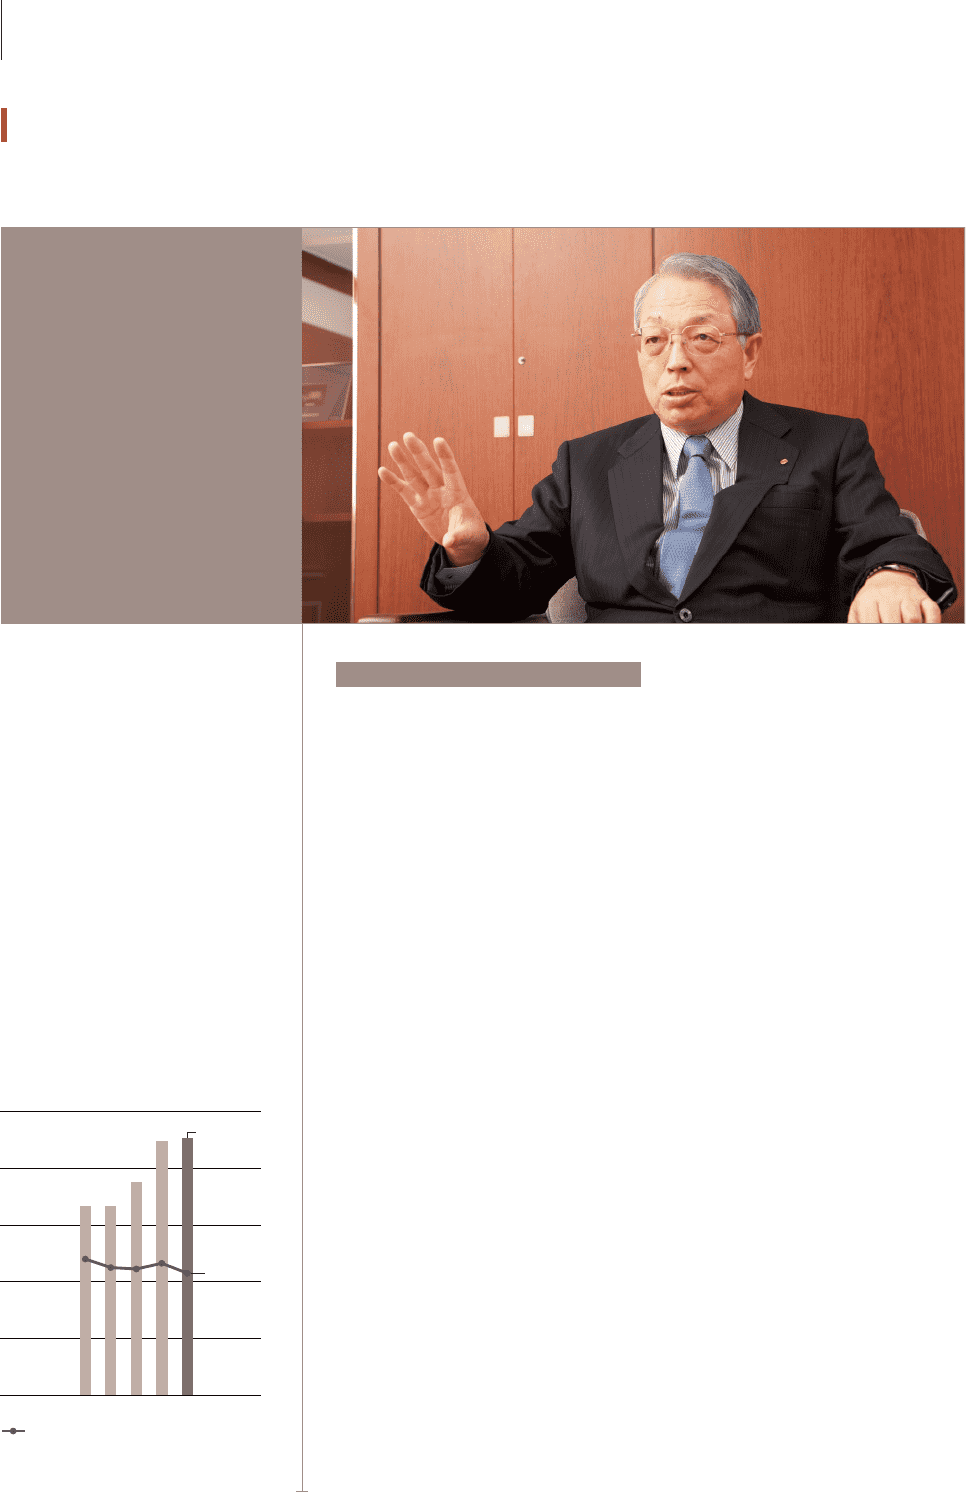
Fiscal 2008 Business Results
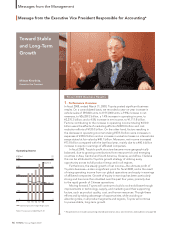
Toward Stable
and Long-Term
Growth
Mitsuo Kinoshita,
Executive Vice President
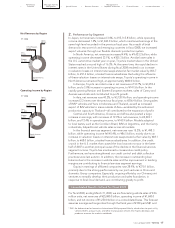
Message from the Executive Vice President Responsible for Accounting*
’04 ’05 ’06 ’07 ’08
0
1,000
500
1,500
2,500
2,000
0
8
4
12
20
16
(¥ Billion) (%)
Operating income margin (Right scale)
FY
2,270.3
8.6%
Operating Income
Note: Fiscal years ended March 31 * Responsibilities include accounting-related operational areas (see Directors and Auditors on page 58)