Toyota 2008 Annual Report Download - page 5
Download and view the complete annual report
Please find page 5 of the 2008 Toyota annual report below. You can navigate through the pages in the report by either clicking on the pages listed below, or by using the keyword search tool below to find specific information within the annual report.-
 1
1 -
 2
2 -
 3
3 -
 4
4 -
 5
5 -
 6
6 -
 7
7 -
 8
8 -
 9
9 -
 10
10 -
 11
11 -
 12
12 -
 13
13 -
 14
14 -
 15
15 -
 16
16 -
17
-
18
-
19
-
20
-
21
-
22
-
23
-
24
-
25
-
26
-
27
-
28
-
29
-
30
-
31
-
32
-
33
-
34
-
35
-
36
-
37
-
38
-
39
-
40
-
41
-
42
-
43
-
44
-
45
-
46
-
47
-
48
-
49
-
50
-
51
-
52
-
53
-
54
-
55
-
56
-
57
-
58
-
59
-
60
-
61
-
62
-
63
-
64
-
65
-
66
-
67
-
68
-
69
-
70
-
71
-
72
-
73
-
74
-
75
-
76
-
77
-
78
-
79
-
80
-
81
-
82
-
83
-
84
-
85
-
86
-
87
-
88
-
89
-
90
-
91
-
92
-
93
-
94
-
95
-
96
-
97
-
98
-
99
-
100
-
101
-
102
-
103
-
104
-
105
-
106
-
107
-
108
-
109
-
110
-
111
-
112
-
113
-
114
-
115
-
116
-
117
-
118
-
119
-
120
-
121
-
122
-
123
-
124
-
125
-
126
-
127
-
128
-
129
-
130
-
131
-
132
-
133
-
134
-
135
-
136
-
137
-
138
 |
 |
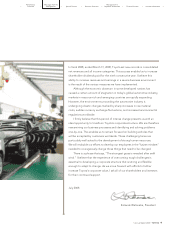
3
•Annual Report 2008 • TOYOTA
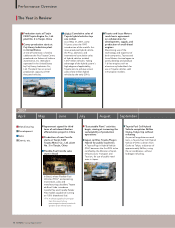
Performance Messages from the Management &
•Overview •Management •Special Feature •Business Overview •Corporate Information •Financial Section •Investor Information •
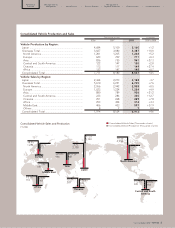
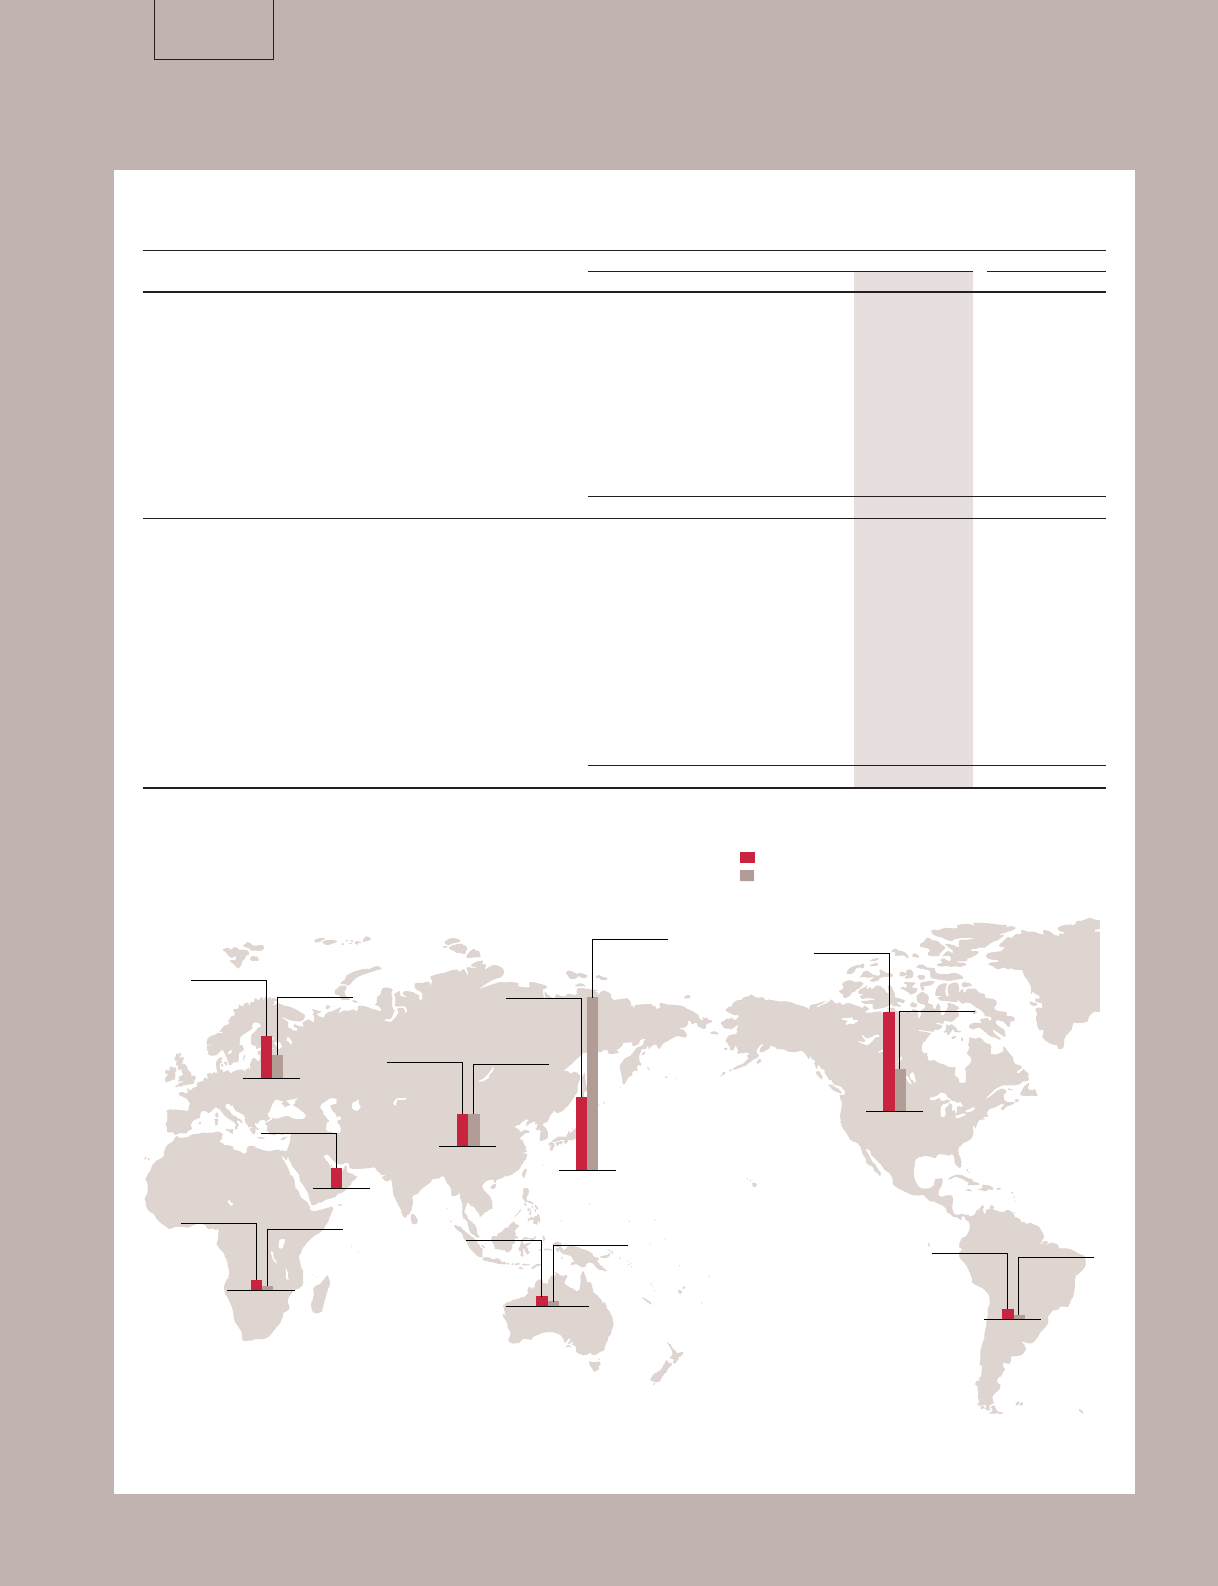
Consolidated Vehicle Production and Sales
Thousands of units % change
2006 2007 2008 2007vs2008
Vehicle Production by Region:
Japan ............................................................................ 4,684 5,100 5,160 +1.2
Overseas Total ............................................................. 3,027 3,080 3,387 +10.0
North America............................................................ 1,201 1,205 1,268 +5.2
Europe ........................................................................ 623 709 711 +0.3
Asia.............................................................................. 836 755 961 +27.3
Central and South America....................................... 122 147 150 +2.0
Oceania....................................................................... 113 117 149 +27.4
Africa........................................................................... 132 147 148 +0.7
Consolidated Total ...................................................... 7,711 8,180 8,547 +4.5
Vehicle Sales by Region:
Japan ............................................................................ 2,364 2,273 2,188 -3.7
Overseas Total ............................................................. 5,610 6,251 6,725 +7.6
North America............................................................ 2,556 2,942 2,958 +0.5
Europe ........................................................................ 1,023 1,224 1,284 +4.9
Asia.............................................................................. 880 789 956 +21.2
Central and South America....................................... 233 284 320 +12.7
Oceania....................................................................... 251 268 289 +7.8
Africa........................................................................... 253 304 314 +3.3
Middle East ................................................................ 406 433 597 +37.9
Others ......................................................................... 8 7 70.0
Consolidated Total ...................................................... 7,974 8,524 8,913 +4.6
Consolidated Vehicle Sales and Production
FY 2008
North America
+0.5%
2,958
+5.2%
1,268
Europe
+4.9%
1,284 +0.3%
711
Central and South
America
+12.7%
320 +2.0%
150
Japan
-3.7%
2,188
+1.2%
5,160
Middle East
+37.9%
597
Africa
+3.3%
314 +0.7%
148
Asia
+21.2%
956 +27.3%
961
Oceania
+7.8%
289 +27.4%
149
Consolidated Vehicle Sales (Thousands of units)
Consolidated Vehicle Production (Thousands of units)