Toyota 2008 Annual Report Download - page 73
Download and view the complete annual report
Please find page 73 of the 2008 Toyota annual report below. You can navigate through the pages in the report by either clicking on the pages listed below, or by using the keyword search tool below to find specific information within the annual report.-
 1
1 -
2
-
3
-
4
-
5
-
6
-
7
-
8
-
9
-
10
-
11
-
12
-
13
-
14
-
15
-
16
-
17
-
18
-
19
-
20
-
21
-
22
-
23
-
24
-
25
-
26
-
27
-
28
-
29
-
30
-
31
-
32
-
33
-
34
-
35
-
36
-
37
-
38
-
39
-
40
-
41
-
42
-
43
-
44
-
45
-
46
-
47
-
48
-
49
-
50
-
51
-
52
-
53
-
54
-
55
-
56
-
57
-
58
-
59
-
60
-
61
-
62
-
 63
63 -
 64
64 -
 65
65 -
 66
66 -
 67
67 -
 68
68 -
 69
69 -
 70
70 -
 71
71 -
 72
72 -
 73
73 -
 74
74 -
 75
75 -
 76
76 -
 77
77 -
 78
78 -
 79
79 -
 80
80 -
 81
81 -
 82
82 -
 83
83 -
84
-
85
-
86
-
87
-
88
-
89
-
90
-
91
-
92
-
93
-
94
-
95
-
96
-
97
-
98
-
99
-
100
-
101
-
102
-
103
-
104
-
105
-
106
-
107
-
108
-
109
-
110
-
111
-
112
-
113
-
114
-
115
-
116
-
117
-
118
-
119
-
120
-
121
-
122
-
123
-
124
-
125
-
126
-
127
-
128
-
129
-
130
-
131
-
132
-
133
-
134
-
135
-
136
-
137
-
138
 |
 |

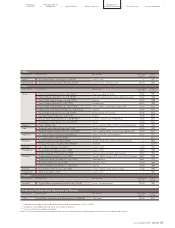
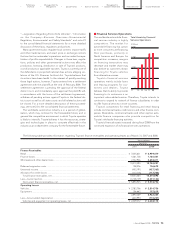
Yen in millions % change
2003 2004 2005 2006 2007 2008 2007 vs 2008
¥14,793,973 ¥16,578,033 ¥17,790,862 ¥20,059,493 ¥22,670,097 ¥24,820,510 +9.5
707,580 716,727 760,664 977,416 1,277,994 1,468,730 +14.9
¥15,501,553 ¥17,294,760 ¥18,551,526 ¥21,036,909 ¥23,948,091 ¥26,289,240 +9.8
¥11,914,245 ¥13,506,337 ¥14,500,282 ¥16,335,312 ¥18,356,255 ¥20,452,338 +11.4
423,885 364,177 369,844 609,632 872,138 1,068,015 +22.5
1,891,777 1,757,356 2,009,213 2,213,623 2,481,015 2,498,512 +0.7
¥14,229,907 ¥15,627,870 ¥16,879,339 ¥19,158,567 ¥21,709,408 ¥24,018,865 +10.6
¥ 1,271,646 ¥ 1,666,890 ¥1,672,187 ¥ 1,878,342 ¥ 2,238,683 ¥2,270,375 +1.4
8.2% 9.6% 9.0% 8.9% 9.3% 8.6% —
1,226,652 1,765,793 1,754,637 2,087,3602,382,516 2,437,222 +2.3
517,014 681,304 657,910 795,153 898,312 911,495 +1.5
750,942 1,162,098 1,171,260 1,372,180 1,644,032 1,717,879 +4.5
10.4% 15.2% 13.6% 14.0% 14.7% 14.5% —
¥ 1,940,088 ¥ 2,186,734 ¥ 2,370,940 ¥2,515,480 ¥ 3,238,173 ¥2,981,624 -7.9
(2,001,448) (2,216,495) (3,061,196) (3,375,500) (3,814,378) (3,874,886) -1.6
37,675 242,223 419,384 876,911 881,768 706,189 -19.9
668,404 682,279 755,147 812,648 890,782 958,882 +7.6
1,005,931 945,803 1,068,287 1,523,459 1,425,814 1,480,570 +3.8
870,636 969,904 997,713 1,211,178 1,382,594 1,491,135 +7.9
¥ 7,121,000 ¥ 8,178,567 ¥ 9,044,950 ¥10,560,449 ¥11,836,092 ¥11,869,527 +0.3
20,152,974 22,040,228 24,335,011 28,731,595 32,574,779 32,458,320 -0.4
4,137,528 4,247,2665,014,925 5,640,490 6,263,585 5,981,931 -4.5
1,592,028 1,729,776 1,483,753 1,569,387 1,900,379 1,628,547 -14.3
35.3% 37.1% 37.2% 36.8% 36.3% 36.6% —
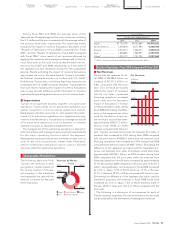
Yen % change
2003 2004 2005 2006 2007 2008 2007 vs 2008
¥ 211.32 ¥ 342.90 ¥ 355.35 ¥ 421.76 ¥ 512.09 ¥540.65 +5.6
36 45 65 90 120 140 +16.7
2,063.43 2,456.08 2,767.67 3,257.63 3,701.17 3,768.97 +1.8
¥2,635 ¥3,880 ¥3,990 ¥6,430 ¥7,550 ¥4,970 -34.2
¥9,512,343 ¥14,006,790 ¥14,403,890 ¥23,212,284 ¥27,255,481 ¥17,136,548 -37.1
3,609,997,492 3,609,997,492 3,609,997,492 3,609,997,492 3,609,997,492 3,447,997,492 —
71
•Annual Report 2008 • TOYOTA
Performance Messages from the Management &
•Overview •Management •Special Feature •Business Overview •Corporate Information •Financial Section •Investor Information •