Toyota 2008 Annual Report Download - page 137
Download and view the complete annual report
Please find page 137 of the 2008 Toyota annual report below. You can navigate through the pages in the report by either clicking on the pages listed below, or by using the keyword search tool below to find specific information within the annual report.-
 1
1 -
2
-
3
-
4
-
5
-
6
-
7
-
8
-
9
-
10
-
11
-
12
-
13
-
14
-
15
-
16
-
17
-
18
-
19
-
20
-
21
-
22
-
23
-
24
-
25
-
26
-
27
-
28
-
29
-
30
-
31
-
32
-
33
-
34
-
35
-
36
-
37
-
38
-
39
-
40
-
41
-
42
-
43
-
44
-
45
-
46
-
47
-
48
-
49
-
50
-
51
-
52
-
53
-
54
-
55
-
56
-
57
-
58
-
59
-
60
-
61
-
62
-
63
-
64
-
65
-
66
-
67
-
68
-
69
-
70
-
71
-
72
-
73
-
74
-
75
-
76
-
77
-
78
-
79
-
80
-
81
-
82
-
83
-
84
-
85
-
86
-
87
-
88
-
89
-
90
-
91
-
92
-
93
-
94
-
95
-
96
-
97
-
98
-
99
-
100
-
101
-
102
-
103
-
104
-
105
-
106
-
107
-
108
-
109
-
110
-
111
-
112
-
113
-
114
-
115
-
116
-
117
-
118
-
119
-
120
-
121
-
122
-
123
-
124
-
125
-
126
-
 127
127 -
 128
128 -
 129
129 -
 130
130 -
 131
131 -
 132
132 -
 133
133 -
 134
134 -
 135
135 -
 136
136 -
 137
137 -
 138
138
 |
 |
135
•Annual Report 2008 • TOYOTA
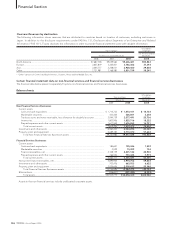
Performance Messages from the Management &
•Overview •Management •Special Feature •Business Overview •Corporate Information •Financial Section •Investor Information •
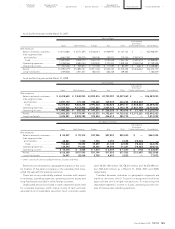
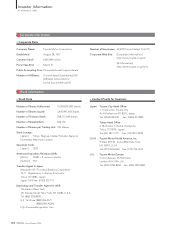
»Major Shareholders (Top 10)
Name Number of
Shares Held
(Thousands)
The Master Trust Bank of Japan, Ltd. 217,049
Japan Trustee Services Bank, Ltd. 216,780
Toyota Industries Corporation 200,195
Nippon Life Insurance Company 131,653
Hero and Company 121,480
Trust and Custody Services Bank, Ltd. 105,072
State Street Bank and Trust Company 97,459
Tokio Marine and Nichido Fire Insurance Co., Ltd. 83,821
Mitsui Sumitomo Insurance Co., Ltd. 65,166
DENSO CORPORATION 58,678
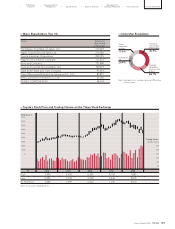
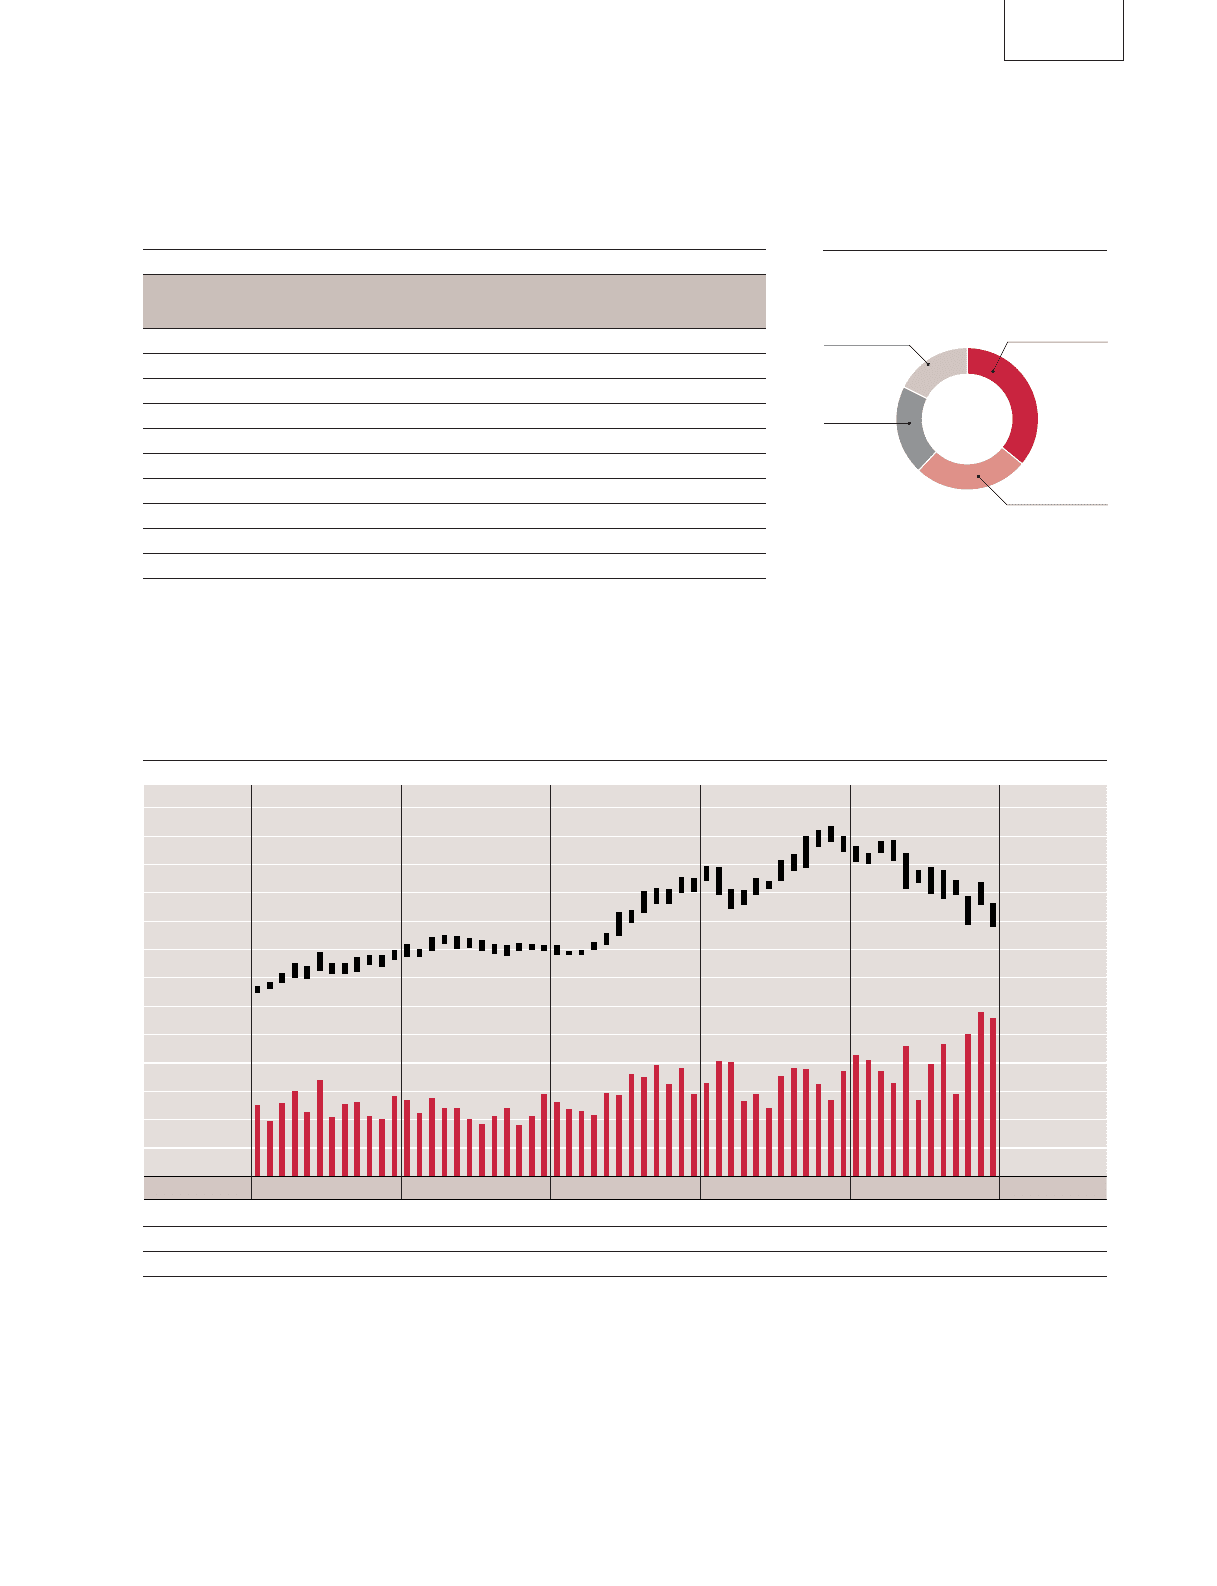
» Toyota’s Stock Price and Trading Volume on the Tokyo Stock Exchange
High 3,990 4,520 6,560 8,350 7,880
Low 2,455 3,730 3,790 5,430 4,810
At Year-End 3,880 3,990 6,430 7,550 4,970
»Ownership Breakdown
Note: Individuals, etc. includes shares of 298 million
treasury stock.
Note: Fiscal years ended March 31
300
250
200
150
100
50
0
9,000
8,000
7,000
6,000
5,000
4,000
3,000
2,000
1,000
0
Trading volume
(Million shares)
Stock price (¥)
2004 2005 2006 2007 2008
FY
Foreign
corporate
entities and
others
26.1%
Financial
institutions,
Brokerages
35.9%
Individuals,
etc.
20.4%
Other
corporate
entities
17.6%