Toyota 2008 Annual Report Download - page 109
Download and view the complete annual report
Please find page 109 of the 2008 Toyota annual report below. You can navigate through the pages in the report by either clicking on the pages listed below, or by using the keyword search tool below to find specific information within the annual report.-
 1
1 -
2
-
3
-
4
-
5
-
6
-
7
-
8
-
9
-
10
-
11
-
12
-
13
-
14
-
15
-
16
-
17
-
18
-
19
-
20
-
21
-
22
-
23
-
24
-
25
-
26
-
27
-
28
-
29
-
30
-
31
-
32
-
33
-
34
-
35
-
36
-
37
-
38
-
39
-
40
-
41
-
42
-
43
-
44
-
45
-
46
-
47
-
48
-
49
-
50
-
51
-
52
-
53
-
54
-
55
-
56
-
57
-
58
-
59
-
60
-
61
-
62
-
63
-
64
-
65
-
66
-
67
-
68
-
69
-
70
-
71
-
72
-
73
-
74
-
75
-
76
-
77
-
78
-
79
-
80
-
81
-
82
-
83
-
84
-
85
-
86
-
87
-
88
-
89
-
90
-
91
-
92
-
93
-
94
-
95
-
96
-
97
-
98
-
 99
99 -
 100
100 -
 101
101 -
 102
102 -
 103
103 -
 104
104 -
 105
105 -
 106
106 -
 107
107 -
 108
108 -
 109
109 -
 110
110 -
 111
111 -
 112
112 -
 113
113 -
 114
114 -
 115
115 -
 116
116 -
 117
117 -
 118
118 -
 119
119 -
120
-
121
-
122
-
123
-
124
-
125
-
126
-
127
-
128
-
129
-
130
-
131
-
132
-
133
-
134
-
135
-
136
-
137
-
138
 |
 |
107
•Annual Report 2008 • TOYOTA
Performance Messages from the Management &
•Overview •Management •Special Feature •Business Overview •Corporate Information •Financial Section •Investor Information •
The other amount includes the impact of consolidation and
deconsolidation of certain entities due to changes in ownership
interest and currency translation adjustments for the years
ended March 31, 2006, 2007 and 2008.
A portion of the allowance for doubtful accounts balance at
March 31, 2007 and 2008 totaling ¥33,284 million and ¥34,592
million ($345 million), respectively, is attributed to certain non-
current receivable balances which are reported as other assets
in the consolidated balance sheets.
Entities comprising a significant portion of Toyota’s invest-
ment in affiliated companies include Denso Corporation; Aioi
Insurance Co., Ltd.; Toyota Industries Corporation; Aisin Seiki
Co., Ltd.; and Toyota Tsusho Corporation.
Certain affiliated companies accounted for by the equity
method with carrying amounts of ¥1,683,093 million and
¥1,677,617 million ($16,744 million) at March 31, 2007 and 2008,
respectively, were quoted on various established markets at an
aggregate value of ¥2,800,848 million and ¥2,229,321 million
($22,251 million), respectively.
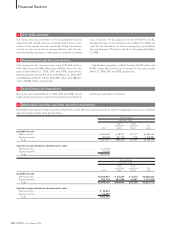
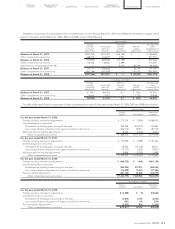
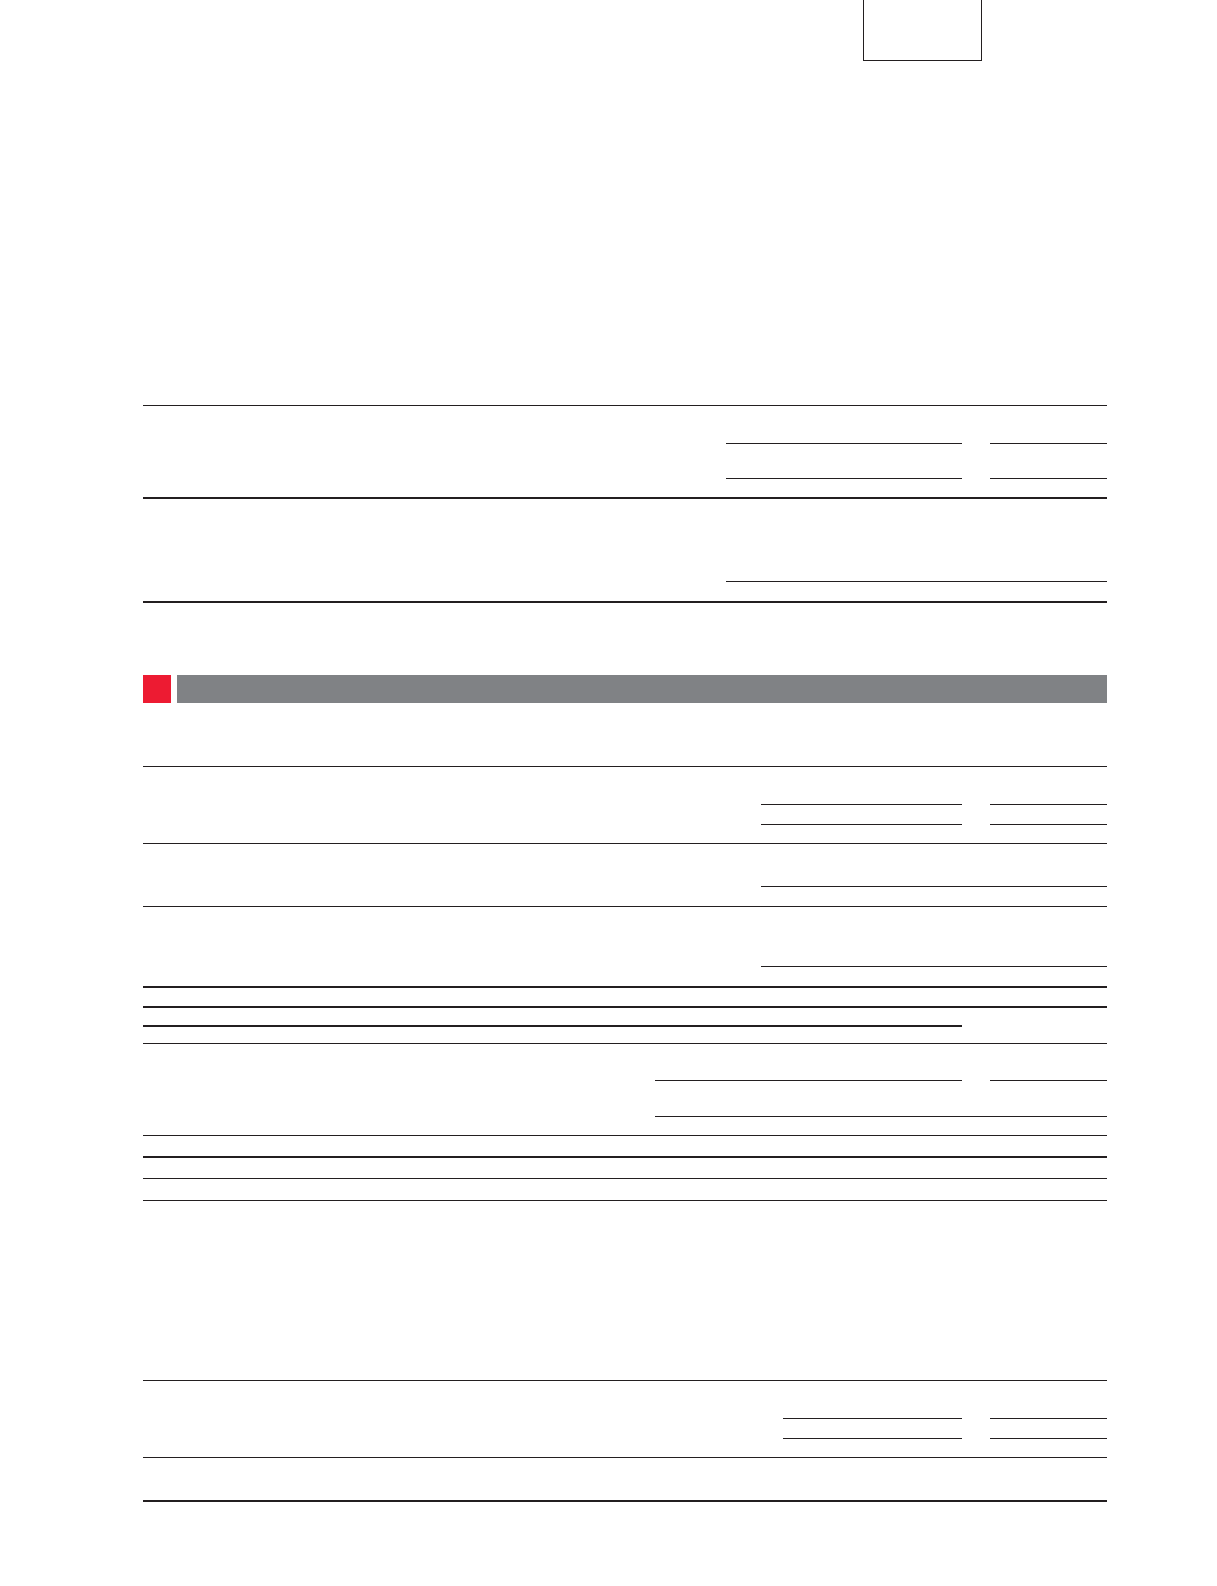
An analysis of the allowance for credit losses relating to finance receivables and vehicles and equipment on operating leases for the
years ended March 31, 2006, 2007 and 2008 is as follows:
U.S. dollars
Yen in millions in millions
For the year ended
For the years ended March 31, March 31,
2006 2007 2008 2008
Allowance for credit losses at beginning of year.............................................................. ¥ 91,829 ¥101,383 ¥112,116 $1,119
Provision for credit losses ................................................................................................... 52,285 72,703 122,433 1,222
Charge-offs, net of recoveries ............................................................................................ (50,324) (63,879) (88,902) (887)
Other..................................................................................................................................... 7,593 1,909 (27,941) (279)
Allowance for credit losses at end of year................................................................. ¥101,383 ¥112,116 ¥117,706 $1,175
The other amount primarily includes the impact of currency translation adjustments for the years ended March 31, 2006, 2007 and 2008.
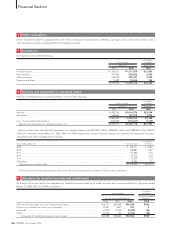
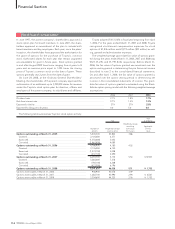
Investments in and transactions with affiliated companies
Summarized financial information for affiliated companies accounted for by the equity method is shown below:
U.S. dollars
Yen in millions in millions
March 31, March 31,
2007 2008 2008
Current assets ............................................................................................................................... ¥ 7,355,056 ¥8,067,295 $ 80,520
Noncurrent assets......................................................................................................................... 11,352,883 10,689,963 106,697
Total assets............................................................................................................................ ¥18,707,939 ¥18,757,258 $187,217
Current liabilities........................................................................................................................... ¥ 5,753,115 ¥6,012,270 $ 60,009
Long-term liabilities...................................................................................................................... 5,945,795 5,619,997 56,093
Shareholders’ equity .................................................................................................................... 7,009,029 7,124,991 71,115
Total liabilities and shareholders’ equity............................................................................ ¥18,707,939 ¥18,757,258 $187,217
Toyota’s share of shareholders’ equity....................................................................................... ¥ 2,027,281 ¥2,065,778 $ 20,619
Number of affiliated companies accounted for by the equity method at end of period ...... 56 55
U.S. dollars
Yen in millions in millions
For the year ended
For the years ended March 31, March 31,
2006 2007 2008 2008
Net revenues ..................................................................................................... ¥18,332,304 ¥23,368,250 ¥26,511,831 $264,616
Gross profit ........................................................................................................ ¥ 2,197,699 ¥ 2,642,377 ¥3,081,366 $ 30,755
Net income ........................................................................................................ ¥ 559,686 ¥ 701,816 ¥870,528 $ 8,689
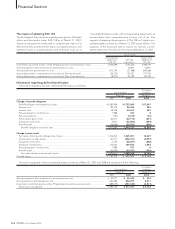
Account balances and transactions with affiliated companies are presented below:
U.S. dollars
Yen in millions in millions
March 31, March 31,
2007 2008 2008
Trade accounts and notes receivable, and other receivables ....................................................... ¥256,761 ¥247,311 $2,468
Accounts payable and other payables.............................................................................................605,598 622,830 6,216
Affiliated companies and variable interest entities:
12
.