Toyota 2008 Annual Report Download - page 132
Download and view the complete annual report
Please find page 132 of the 2008 Toyota annual report below. You can navigate through the pages in the report by either clicking on the pages listed below, or by using the keyword search tool below to find specific information within the annual report.-
 1
1 -
2
-
3
-
4
-
5
-
6
-
7
-
8
-
9
-
10
-
11
-
12
-
13
-
14
-
15
-
16
-
17
-
18
-
19
-
20
-
21
-
22
-
23
-
24
-
25
-
26
-
27
-
28
-
29
-
30
-
31
-
32
-
33
-
34
-
35
-
36
-
37
-
38
-
39
-
40
-
41
-
42
-
43
-
44
-
45
-
46
-
47
-
48
-
49
-
50
-
51
-
52
-
53
-
54
-
55
-
56
-
57
-
58
-
59
-
60
-
61
-
62
-
63
-
64
-
65
-
66
-
67
-
68
-
69
-
70
-
71
-
72
-
73
-
74
-
75
-
76
-
77
-
78
-
79
-
80
-
81
-
82
-
83
-
84
-
85
-
86
-
87
-
88
-
89
-
90
-
91
-
92
-
93
-
94
-
95
-
96
-
97
-
98
-
99
-
100
-
101
-
102
-
103
-
104
-
105
-
106
-
107
-
108
-
109
-
110
-
111
-
112
-
113
-
114
-
115
-
116
-
117
-
118
-
119
-
120
-
121
-
 122
122 -
 123
123 -
 124
124 -
 125
125 -
 126
126 -
 127
127 -
 128
128 -
 129
129 -
 130
130 -
 131
131 -
 132
132 -
 133
133 -
 134
134 -
 135
135 -
 136
136 -
 137
137 -
 138
138
 |
 |

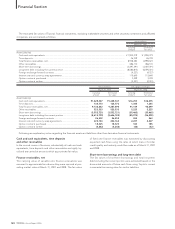
130 TOYOTA •Annual Report 2008 •
Financial Section
Yen in millions U.S. dollars in millions
For the year ended March 31, 2008 For the year ended March 31, 2008
Non-Financial Financial Non-Financial Financial
Services Services Services Services
Businesses Businesses Consolidated Businesses Businesses Consolidated
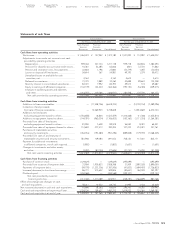
Cash flows from operating activities
Net income........................................................................ ¥ 1,671,859 ¥ 45,995 ¥ 1,717,879 $ 16,687 $ 459 $ 17,146
Adjustments to reconcile net income to net cash
provided by operating activities
Depreciation.................................................................. 1,081,410 409,725 1,491,135 10,793 4,090 14,883
Provision for doubtful accounts and credit losses ..... 357 122,433 122,790 4 1,222 1,226
Pension and severance costs, less payments ............. (54,868) 527 (54,341) (547) 5 (542)
Losses on disposal of fixed assets............................... 44,993 444 45,437 449 5 454
Unrealized losses on available-for-sale
securities, net .............................................................. 11,346 — 11,346 113 — 113
Deferred income taxes................................................. 80,027 1,500 81,458 798 15 813
Minority interest in consolidated subsidiaries............ 73,543 4,419 77,962 734 44 778
Equity in earnings of affiliated companies.................. (268,025) (2,089) (270,114) (2,675) (21) (2,696)
Changes in operating assets and liabilities,
and other ..................................................................... (220,217) 215,218 (241,928) (2,198) 2,148 (2,415)
Net cash provided by operating activities.............. 2,420,425 798,172 2,981,624 24,158 7,967 29,760
Cash flows from investing activities
Additions to finance receivables ..................................... — (16,644,139) (8,647,717) — (166,126) (86,313)
Collection of and proceeds
from sale of finance receivables .................................... —15,095,380 7,332,697 — 150,667 73,188
Additions to fixed assets
excluding equipment leased to others......................... (1,472,422) (8,148) (1,480,570) (14,697) (81) (14,778)
Additions to equipment leased to others ...................... (137,711) (1,141,694) (1,279,405) (1,375) (11,395) (12,770)
Proceeds from sales of fixed assets
excluding equipment leased to others......................... 56,603 10,948 67,551 565 109 674
Proceeds from sales of equipment leased to others..... 80,944 294,937 375,881 808 2,944 3,752
Purchases of marketable securities
and security investments................................................ (936,324) (215,316) (1,151,640) (9,346) (2,149) (11,495)
Proceeds from sales of and maturity of
marketable securities and security investments........... 789,366 198,044 987,410 7,879 1,977 9,856
Payment for additional investments
in affiliated companies, net of cash acquired............... (4,406) — (4,406) (44) — (44)
Changes in investments and other assets,
and other ......................................................................... (44,891) 23,024 (74,687) (447) 230 (745)
Net cash used in investing activities ....................... (1,668,841) (2,386,964) (3,874,886) (16,657) (23,824) (38,675)
Cash flows from financing activities
Purchase of common stock.............................................. (311,667) — (311,667) (3,111) — (3,111)
Proceeds from issuance of long-term debt.................... 17,162 3,364,351 3,349,812 171 33,579 33,434
Payments of long-term debt............................................ (226,561) (2,156,709) (2,310,008) (2,261) (21,526) (23,056)
Increase in short-term borrowings .................................. 24,126 370,293 408,912 241 3,696 4,081
Dividends paid .................................................................. (430,860) — (430,860) (4,300) — (4,300)
Net cash provided by (used in)
financing activities................................................... (927,800) 1,577,935 706,189 (9,260) 15,749 7,048
Effect of exchange rate changes on cash
and cash equivalents .......................................................... (65,405) (19,354) (84,759) (653) (193) (846)
Net decrease in cash and cash equivalents........................ (241,621) (30,211) (271,832) (2,412) (301) (2,713)
Cash and cash equivalents at beginning of year ............... 1,714,722 185,657 1,900,379 17,115 1,853 18,968
Cash and cash equivalents at end of year .......................... ¥ 1,473,101 ¥ 155,446 ¥ 1,628,547 $ 14,703 $ 1,552 $ 16,255