Toyota 2008 Annual Report Download - page 104
Download and view the complete annual report
Please find page 104 of the 2008 Toyota annual report below. You can navigate through the pages in the report by either clicking on the pages listed below, or by using the keyword search tool below to find specific information within the annual report.-
 1
1 -
2
-
3
-
4
-
5
-
6
-
7
-
8
-
9
-
10
-
11
-
12
-
13
-
14
-
15
-
16
-
17
-
18
-
19
-
20
-
21
-
22
-
23
-
24
-
25
-
26
-
27
-
28
-
29
-
30
-
31
-
32
-
33
-
34
-
35
-
36
-
37
-
38
-
39
-
40
-
41
-
42
-
43
-
44
-
45
-
46
-
47
-
48
-
49
-
50
-
51
-
52
-
53
-
54
-
55
-
56
-
57
-
58
-
59
-
60
-
61
-
62
-
63
-
64
-
65
-
66
-
67
-
68
-
69
-
70
-
71
-
72
-
73
-
74
-
75
-
76
-
77
-
78
-
79
-
80
-
81
-
82
-
83
-
84
-
85
-
86
-
87
-
88
-
89
-
90
-
91
-
92
-
93
-
 94
94 -
 95
95 -
 96
96 -
 97
97 -
 98
98 -
 99
99 -
 100
100 -
 101
101 -
 102
102 -
 103
103 -
 104
104 -
 105
105 -
 106
106 -
 107
107 -
 108
108 -
 109
109 -
 110
110 -
 111
111 -
 112
112 -
 113
113 -
 114
114 -
115
-
116
-
117
-
118
-
119
-
120
-
121
-
122
-
123
-
124
-
125
-
126
-
127
-
128
-
129
-
130
-
131
-
132
-
133
-
134
-
135
-
136
-
137
-
138
 |
 |

102 TOYOTA •Annual Report 2008 •
Financial Section
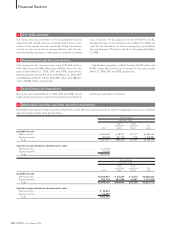
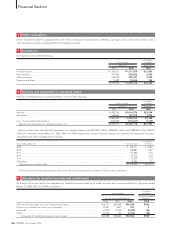
Marketable securities and other securities investments include debt and equity securities for which the aggregate cost, gross unrealized
gains and losses and fair value are as follows:
Yen in millions
March 31, 2007
Gross Gross
unrealized unrealized Fair
Cost gains losses value
Available-for-sale
Debt securities............................................................................................................. ¥2,454,283 ¥ 18,141 ¥12,172 ¥2,460,252
Equity securities........................................................................................................... 859,628 821,518 1,259 1,679,887
Total.......................................................................................................................... ¥3,313,911 ¥839,659 ¥13,431 ¥4,140,139
Securities not practicable to determine fair value
Debt securities............................................................................................................. ¥ 24,322
Equity securities........................................................................................................... 100,854
Total.......................................................................................................................... ¥125,176
Yen in millions
March 31, 2008
Gross Gross
unrealized unrealized Fair
Cost gains losses value
Available-for-sale
Debt securities............................................................................................................. ¥2,602,951 ¥ 52,345 ¥ 4,673 ¥2,650,623
Equity securities........................................................................................................... 853,174 342,596 18,681 1,177,089
Total.......................................................................................................................... ¥3,456,125 ¥394,941 ¥23,354 ¥3,827,712
Securities not practicable to determine fair value
Debt securities............................................................................................................. ¥30,239
Equity securities........................................................................................................... 113,497
Total.......................................................................................................................... ¥143,736
Marketable securities and other securities investments: 6.
U.S. dollar amounts presented in the consolidated financial
statements and related notes are included solely for the conve-
nience of the reader and are unaudited. These translations
should not be construed as representations that the yen
amounts actually represent, or have been or could be converted
into, U.S. dollars. For this purpose, the rate of ¥100.19 = U.S. $1,
the approximate current exchange rate at March 31, 2008, was
used for the translation of the accompanying consolidated
financial amounts of Toyota as of and for the year ended March
31, 2008.
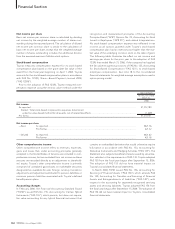
Cash payments for income taxes were ¥730,469 million,
¥741,798 million and ¥921,798 million ($9,200 million) for the
years ended March 31, 2006, 2007 and 2008, respectively.
Interest payments during the years ended March 31, 2006, 2007
and 2008 were ¥332,337 million, ¥550,398 million and ¥686,215
million ($6,849 million), respectively.
Capital lease obligations of ¥6,673 million, ¥6,559 million and
¥7,401 million ($74 million) were incurred for the years ended
March 31, 2006, 2007 and 2008, respectively.
During the years ended March 31, 2006, 2007 and 2008, Toyota
made several acquisitions, however the assets acquired and lia-
bilities assumed were not material.
U.S. dollar amounts: 3.
Supplemental cash flow information: 4.
Acquisitions and dispositions: 5.