Toyota 2008 Annual Report Download - page 13
Download and view the complete annual report
Please find page 13 of the 2008 Toyota annual report below. You can navigate through the pages in the report by either clicking on the pages listed below, or by using the keyword search tool below to find specific information within the annual report.-
 1
1 -
2
-
 3
3 -
 4
4 -
 5
5 -
 6
6 -
 7
7 -
 8
8 -
 9
9 -
 10
10 -
 11
11 -
 12
12 -
 13
13 -
 14
14 -
 15
15 -
 16
16 -
 17
17 -
 18
18 -
 19
19 -
 20
20 -
 21
21 -
 22
22 -
 23
23 -
24
-
25
-
26
-
27
-
28
-
29
-
30
-
31
-
32
-
33
-
34
-
35
-
36
-
37
-
38
-
39
-
40
-
41
-
42
-
43
-
44
-
45
-
46
-
47
-
48
-
49
-
50
-
51
-
52
-
53
-
54
-
55
-
56
-
57
-
58
-
59
-
60
-
61
-
62
-
63
-
64
-
65
-
66
-
67
-
68
-
69
-
70
-
71
-
72
-
73
-
74
-
75
-
76
-
77
-
78
-
79
-
80
-
81
-
82
-
83
-
84
-
85
-
86
-
87
-
88
-
89
-
90
-
91
-
92
-
93
-
94
-
95
-
96
-
97
-
98
-
99
-
100
-
101
-
102
-
103
-
104
-
105
-
106
-
107
-
108
-
109
-
110
-
111
-
112
-
113
-
114
-
115
-
116
-
117
-
118
-
119
-
120
-
121
-
122
-
123
-
124
-
125
-
126
-
127
-
128
-
129
-
130
-
131
-
132
-
133
-
134
-
135
-
136
-
137
-
138
 |
 |

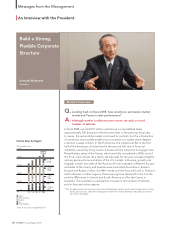
11
•Annual Report 2008 • TOYOTA
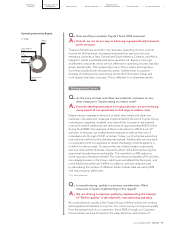
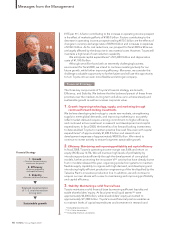
Q.How would you evaluate Toyota’s fiscal 2008 revenues?
A.Overall, we are on our way to achieving a geographically balanced
profit structure.
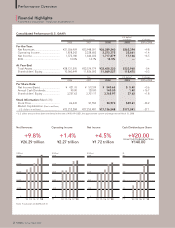
Toyota achieved new records in net revenues, operating income, and net
income for the fiscal year. Increased revenues from resource-rich and
emerging countries in Asia, Central and South America, Oceania, and Africa
helped to create a well-balanced revenues structure. Equity in earnings
of affiliated companies, which are not reflected in operating income, has also
grown substantially. This is especially true in China, where earnings have
more than doubled over the past four years. I believe that our growth
strategy of utilizing every opportunity across the full product lineup and
in all regions has been a success. This is reflected in our business results.
Q.As the price of steel and other raw materials continues to rise,
what measures is Toyota taking to reduce costs?
A.From the development phase to final production, we are reviewing
every aspect of our operations to find ways to reduce costs.
Despite sharp increases in the price of steel, rare metals and other raw
materials, cost reduction measures implemented by the entire Toyota Group,
including our suppliers, enabled us to absorb the increase in raw material
costs and achieve additional cost reductions of approximately ¥120.0 billion
during fiscal 2008. One example of these cost reduction efforts is our VI*
activities. In the past, we implemented measures to reduce the cost of
individual parts through CCC21 activities. Today, our VI activities extend our
cost reduction efforts to the development phase. Additionally, we now work
in cooperation with our suppliers to review the design of entire systems in
an effort to reduce costs. To reduce the cost of resin-based components,
we have reduced the thickness of parts by about half while maintaining the
same level of performance and quality. This resulted in a 30% reduction
in the quantity of material needed. The cost reduction benefits of VI activities
can already be seen in the Crown, which was remodeled this fiscal year, and
in the Alphard and the new Vellfire. In addition, we have reduced costs
by decreasing the number of different kinds of sheet steel we use by 20%
and improving our yield rates.
* VI = Value Innovation
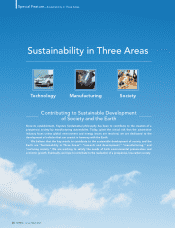
Q.In manufacturing, quality is a primary consideration. What
measures is Toyota implementing in this regard?
A.We are striving to improve quality by implementing the concept
of “Built-in quality” in development, manufacturing and sales.
As a manufacturer, quality is the Toyota Group’s lifeline and we are working
with suppliers and dealers to improve. Our main priority is to improve quality
from the perspective of our customers. Since 2005, through our Customer
First activities, we have focused on the early detection and solution of
Management Issues
Performance Messages from the Management &
•Overview •Management •Special Feature •Business Overview •Corporate Information •Financial Section •Investor Information •
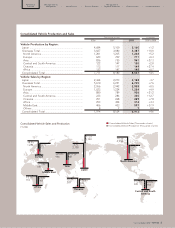
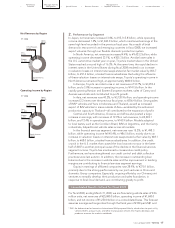
North America
13.3%
Japan
63.0%
Other Regions
6.3%
Asia
11.2%
Europe
6.2%
FY 2008
Operating Income by Region