Toyota 2008 Annual Report Download - page 77
Download and view the complete annual report
Please find page 77 of the 2008 Toyota annual report below. You can navigate through the pages in the report by either clicking on the pages listed below, or by using the keyword search tool below to find specific information within the annual report.-
 1
1 -
2
-
3
-
4
-
5
-
6
-
7
-
8
-
9
-
10
-
11
-
12
-
13
-
14
-
15
-
16
-
17
-
18
-
19
-
20
-
21
-
22
-
23
-
24
-
25
-
26
-
27
-
28
-
29
-
30
-
31
-
32
-
33
-
34
-
35
-
36
-
37
-
38
-
39
-
40
-
41
-
42
-
43
-
44
-
45
-
46
-
47
-
48
-
49
-
50
-
51
-
52
-
53
-
54
-
55
-
56
-
57
-
58
-
59
-
60
-
61
-
62
-
63
-
64
-
65
-
66
-
 67
67 -
 68
68 -
 69
69 -
 70
70 -
 71
71 -
 72
72 -
 73
73 -
 74
74 -
 75
75 -
 76
76 -
 77
77 -
 78
78 -
 79
79 -
 80
80 -
 81
81 -
 82
82 -
 83
83 -
 84
84 -
 85
85 -
 86
86 -
 87
87 -
88
-
89
-
90
-
91
-
92
-
93
-
94
-
95
-
96
-
97
-
98
-
99
-
100
-
101
-
102
-
103
-
104
-
105
-
106
-
107
-
108
-
109
-
110
-
111
-
112
-
113
-
114
-
115
-
116
-
117
-
118
-
119
-
120
-
121
-
122
-
123
-
124
-
125
-
126
-
127
-
128
-
129
-
130
-
131
-
132
-
133
-
134
-
135
-
136
-
137
-
138
 |
 |
■
75
•Annual Report 2008 • TOYOTA
Performance Messages from the Management &
•Overview •Management •Special Feature •Business Overview •Corporate Information •Financial Section •Investor Information •
“—Legislation Regarding End-of-Life Vehicles”, “Information
on the Company—Business Overview—Governmental
Regulation, Environmental and Safety Standards” and note 23
to the consolidated financial statements for a more detailed
discussion of these laws, regulations and policies.
Many governments also regulate local content, impose tariffs
and other trade barriers, and enact price or exchange controls
that can limit an automaker’s operations and can make the repa-
triation of profits unpredictable. Changes in these laws, regula-
tions, policies and other governmental actions may affect the
production, licensing, distribution or sale of Toyota’s products,
cost of products or applicable tax rates. Toyota is currently one of
the defendants in purported national class actions alleging vio-
lations of the U.S. Sherman Antitrust Act. Toyota believes that
its actions have been lawful. In the interest of quickly resolving
these legal actions, however, Toyota entered into a settlement
agreement with the plaintiffs at the end of February 2006. The
settlement agreement is pending the approval of the federal
district court, and immediately upon approval the plaintiffs will,
in accordance with the terms of the settlement agreement,
withdraw all pending actions against Toyota in the federal dis-
trict court as well as all state courts and all related actions will
be closed. For a more detailed description of these proceed-
ings, see note 23 to the consolidated financial statements.
The worldwide automotive industry is in a period of global-
ization, which may continue for the foreseeable future, and in
general the competitive environment in which Toyota operates
is likely to intensify. Toyota believes it has the resources, strate-
gies and technologies in place to compete effectively in the
industry as an independent company for the foreseeable future.
■Financial Services Operations
The worldwide automobile finan-
cial services industry is highly
competitive. The market for
automobile financing has grown
as more consumers are financing
their purchases, primarily in
North America and Europe. As
competition increases, margins
on financing transactions may
decrease and market share may
also decline as customers obtain
financing for Toyota vehicles
from alternative sources.
Toyota’s financial services
operations mainly include loans
and leasing programs for cus-
tomers and dealers. Toyota
believes that its ability to provide
financing to its customers is an
important value added service. Therefore, Toyota intends to
continue to expand its network of finance subsidiaries in order
to offer financial services in more countries.
Toyota’s competitors for retail financing and retail leasing
include commercial banks, credit unions and other finance com-
panies. Meanwhile, commercial banks and other captive auto-
mobile finance companies also provide competition for
Toyota’s wholesale financing activities.
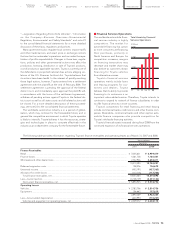
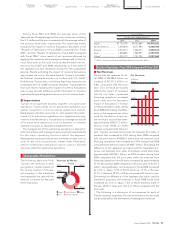
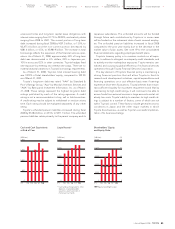
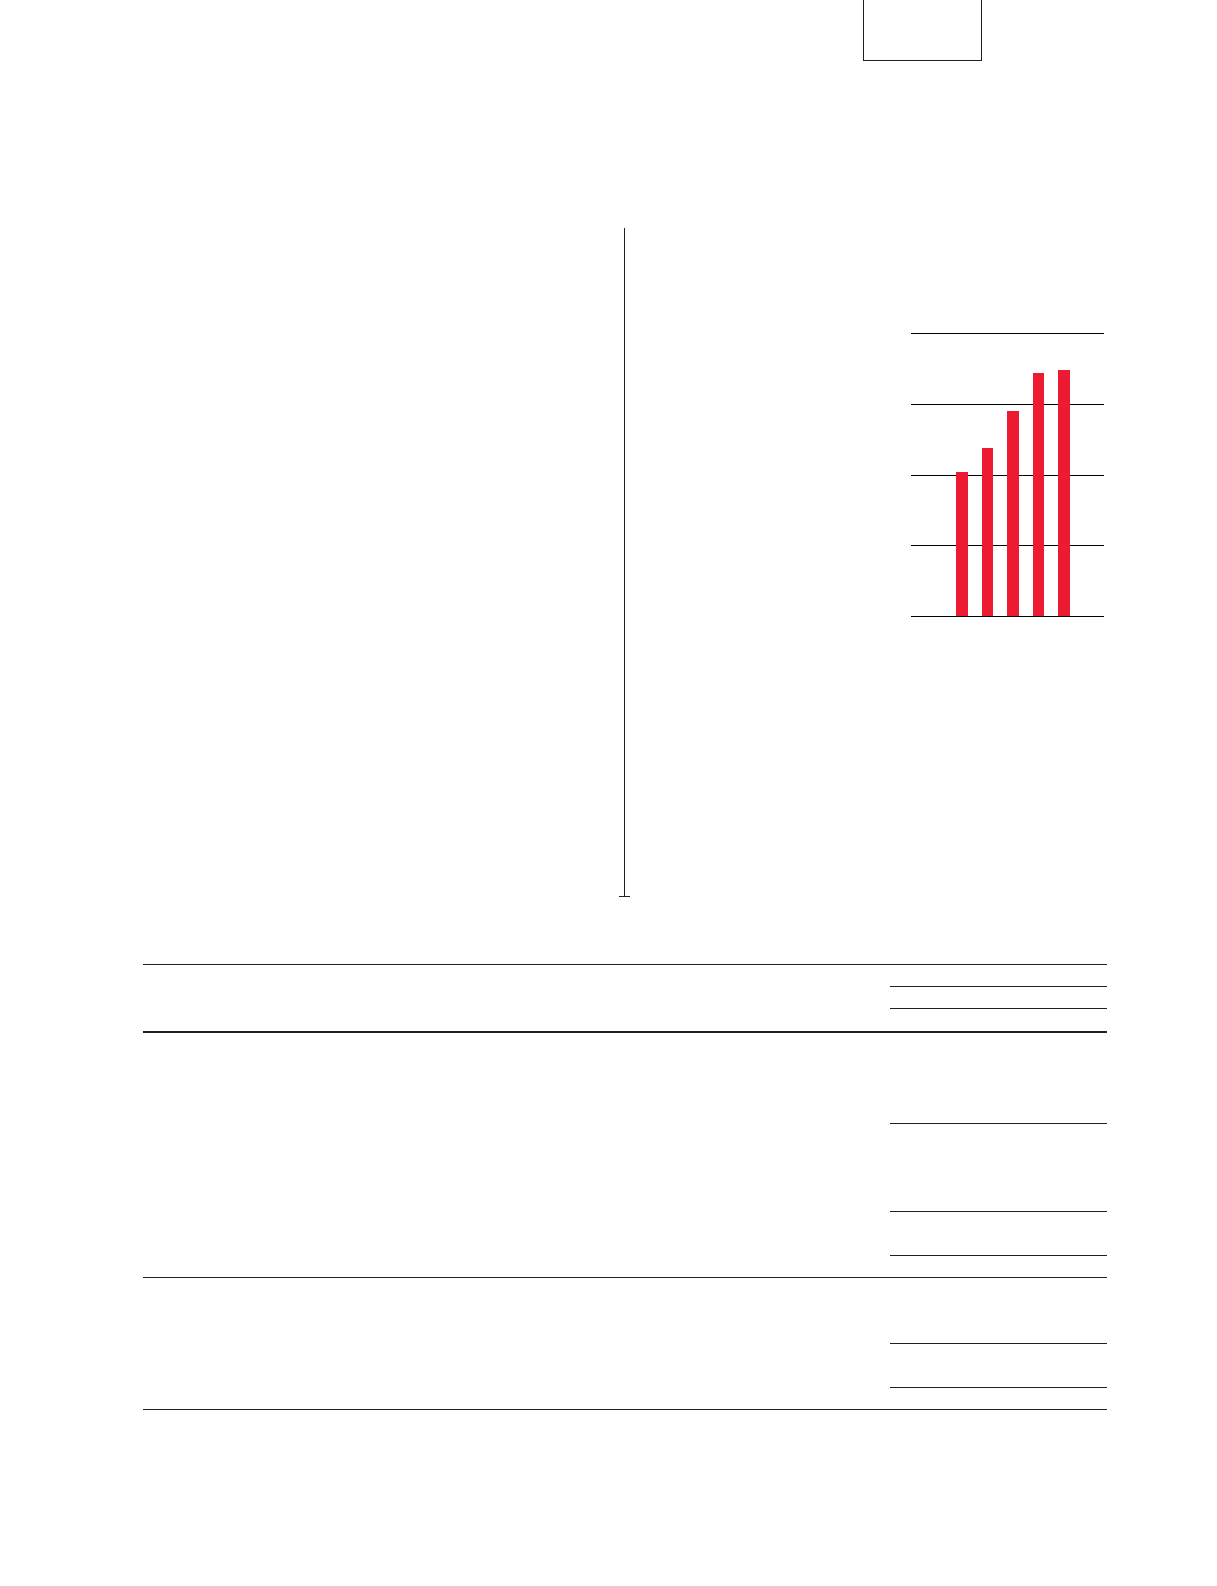
Toyota’s financial assets increased during fiscal 2008 from the
continued expansion of its financial services operations.
’04FY ’05 ’06 ’07 ’08
0
8,000
16,000
4,000
12,000
(¥ Billion)
Total Assets by Financial
Services Operations
The following table provides information regarding Toyota’s finance receivables and operating leases as of March 31, 2007 and 2008.
Yen in millions
March 31,
2007 2008
Finance Receivables
Retail .............................................................................................................................................................................. ¥ 7,005,631 ¥6,959,479
Finance leases............................................................................................................................................................... 1,061,738 1,160,401
Wholesale and other dealer loans .............................................................................................................................. 2,342,926 2,604,411
10,410,295 10,724,291
Deferred origination costs ........................................................................................................................................... 108,076 106,678
Unearned income ......................................................................................................................................................... (403,191) (437,365)
Allowance for credit losses .......................................................................................................................................... (112,116) (117,706)
Total finance receivables, net.................................................................................................................................. 10,003,064 10,275,898
Less—Current portion.................................................................................................................................................. (4,108,139) (4,301,142)
Noncurrent finance receivables, net ....................................................................................................................... ¥ 5,894,925 ¥5,974,756
Operating Leases
Vehicles.......................................................................................................................................................................... ¥ 2,783,706 ¥2,814,706
Equipment..................................................................................................................................................................... 106,663 107,619
2,890,369 2,922,325
Less—Accumulated depreciation ............................................................................................................................... (640,997) (718,207)
Vehicles and equipment on operating leases, net ................................................................................................ ¥ 2,249,372 ¥2,204,118