Toyota 2008 Annual Report Download - page 84
Download and view the complete annual report
Please find page 84 of the 2008 Toyota annual report below. You can navigate through the pages in the report by either clicking on the pages listed below, or by using the keyword search tool below to find specific information within the annual report.-
 1
1 -
2
-
3
-
4
-
5
-
6
-
7
-
8
-
9
-
10
-
11
-
12
-
13
-
14
-
15
-
16
-
17
-
18
-
19
-
20
-
21
-
22
-
23
-
24
-
25
-
26
-
27
-
28
-
29
-
30
-
31
-
32
-
33
-
34
-
35
-
36
-
37
-
38
-
39
-
40
-
41
-
42
-
43
-
44
-
45
-
46
-
47
-
48
-
49
-
50
-
51
-
52
-
53
-
54
-
55
-
56
-
57
-
58
-
59
-
60
-
61
-
62
-
63
-
64
-
65
-
66
-
67
-
68
-
69
-
70
-
71
-
72
-
73
-
 74
74 -
 75
75 -
 76
76 -
 77
77 -
 78
78 -
 79
79 -
 80
80 -
 81
81 -
 82
82 -
 83
83 -
 84
84 -
 85
85 -
 86
86 -
 87
87 -
 88
88 -
 89
89 -
 90
90 -
 91
91 -
 92
92 -
 93
93 -
 94
94 -
95
-
96
-
97
-
98
-
99
-
100
-
101
-
102
-
103
-
104
-
105
-
106
-
107
-
108
-
109
-
110
-
111
-
112
-
113
-
114
-
115
-
116
-
117
-
118
-
119
-
120
-
121
-
122
-
123
-
124
-
125
-
126
-
127
-
128
-
129
-
130
-
131
-
132
-
133
-
134
-
135
-
136
-
137
-
138
 |
 |

82 TOYOTA •Annual Report 2008 •
Financial Section
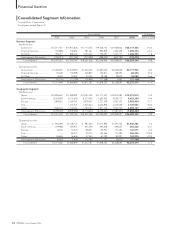
During fiscal 2007, operating income (before the elimination
of intersegment profits) by significant geographies resulted in
an increase of ¥381.3 billion, or 35.4%, in Japan, a decrease of
¥46.0 billion, or 9.3%, in North America, an increase of ¥43.4 bil-
lion, or 46.2% in Europe, a decrease of ¥27.9 billion, or 19.2%, in
Asia, and an increase of ¥16.3 billion, or 24.3% in Other com-
pared with the prior year. The increase in Japan relates primari-
ly to the vehicle unit sales growth in the export markets partially
offset by changes in sales mix, continued cost reduction efforts
and the favorable impact of fluctuations in foreign currency
translation rates. The increase was partially offset by increases
in research and development expenses. The decrease in North
America is attributed primarily to the impact of start-up costs
relating to the Texas plant, and the impact of losses due to
changes in the fair value of derivative financial instruments such
as interest rate swaps, partially offset by the increase in vehicle
unit sales, the impact of cost reduction efforts in the manufac-
turing operations and the favorable impact of fluctuations in
foreign currency translation rates. The increase in Europe
relates mainly to the impact of an increase in production vol-
ume and vehicle unit sales, cost reduction efforts in the manu-
facturing operations and the favorable impact of fluctuations in
foreign currency translation rates. The decrease in Asia relates
primarily to the decrease in production volume and vehicle unit
sales. The increase in Other relates primarily to the impact of
the increase in production volume and vehicle unit sales mainly
attributed to the IMV series.
The following is a discussion of operating income for each of
Toyota’s business segments. The operating income amounts
discussed are before the elimination of intersegment profits.
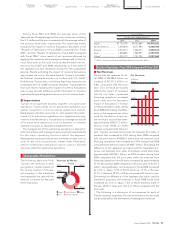
• Automotive Operations Segment
Operating income from Toyota’s automotive operations
increased by ¥344.8 billion, or 20.4%, to ¥2,038.8 billion during
fiscal 2007 compared with the prior year. This increase is primar-
ily attributed to the increase in vehicle unit sales, the increase in
parts sales, the impact of continued cost reduction efforts and
the favorable impact of fluctuations in foreign currency transla-
tion rates. This increase was partially offset by, the increase in
research and development expenses and the increase in
expenses corresponding to business expansion.
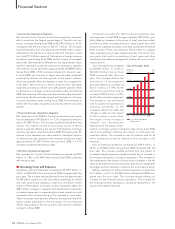
• Financial Services Operations Segment
Operating income from Toyota’s financial services operations
increased by ¥2.7 billion, or 1.7%, to ¥158.5 billion during fiscal
2007 compared with the prior year. This increase is primarily
attributed to the impact of a higher volume of financing activi-
ties mainly in North America and the favorable impact of fluctu-
ations in foreign currency translation rates, which was partially
offset by the impact of losses due to changes in the fair value of
derivative financial instruments such as interest rate swaps.
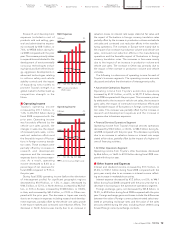
• All Other Operations Segment
Operating income from Toyota’s other businesses remained
consistent to ¥39.6 billion during fiscal 2007 compared with the
prior year.
■Other Income and Expenses
Interest and dividend income increased by ¥38.0 billion, or
40.4%, to ¥132.0 billion during fiscal 2007 compared with the
prior year mainly due to an increase in investment securities
held by the United States subsidiaries.
Interest expense increased by ¥27.7 billion, or 2.3 times to
¥49.3 billion during fiscal 2007 compared with the prior year
due to an increase in interest expense in the automotive opera-
tions segment.
Foreign exchange gains, net increased by ¥22.2 billion, or 3.1
times, to ¥33.0 billion during fiscal 2007 compared with the
prior year. Foreign exchange gains and losses include the dif-
ferences between the value of foreign currency denominated
sales translated at prevailing exchange rates and the value of
the sales amounts settled during the year, including those set-
tled using forward foreign currency exchange contracts.
Other income, net decreased by ¥97.6 billion, or 77.6%, to
¥28.2 billion during fiscal 2007 compared with the prior year.
This decrease primarily relates to the gain of ¥143.3 billion for a
nonmonetary exchange of marketable equity securities recorded
during fiscal 2006. The gain was calculated in accordance with
Emerging Issues Task Force (“EITF”) No. 91-5 “Nonmonetary
Exchange of Cost-Method Investments”, which was determined
as the difference between acquisition costs of pre-merger UFJ
Holdings, Inc. shares that Toyota had held and the fair market
value of post-merger Mitsubishi UFJ Financial Group, Inc.
shares that Toyota received in exchange for shares of UFJ
Holdings, Inc. following the merger between Mitsubishi Tokyo
Financial Group, Inc. and UFJ Holdings, Inc.
■Income Taxes
The provision for income taxes increased by ¥103.2 billion, or
13.0%, to ¥898.3 billion during fiscal 2007 compared with the
prior year primarily due to the increase in income before
income taxes. The effective tax rate for fiscal 2007 remained rel-
atively unchanged compared to the rate for fiscal 2006.
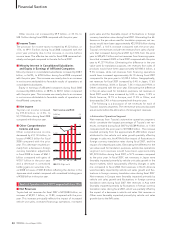
■Minority Interest in Consolidated Subsidiaries
and Equity in Earnings of Affiliated Companies
Minority interest in consolidated subsidiaries decreased by
¥34.7 billion, or 41.1%, to ¥49.7 billion during fiscal 2007 com-
pared with the prior year. This decrease was mainly due to the
decrease of a gain calculated in accordance with EITF 91-5 from
the nonmonetary exchange of marketable equity investments
related shares of UFJ Holdings, Inc. held by a domestic consoli-
dated subsidiary prior to the merger with Mitsubishi Tokyo
Financial Group, Inc. resulting in the receipt of new shares in
the post-merger entity.
Equity in earnings of affiliated companies during fiscal 2007
increased by ¥45.2 billion, or 27.5%, to ¥209.5 billion compared
with the prior year due to an increase in net income attributable
to favorable operations at the affiliated companies.
■
■