Toyota 2008 Annual Report Download - page 106
Download and view the complete annual report
Please find page 106 of the 2008 Toyota annual report below. You can navigate through the pages in the report by either clicking on the pages listed below, or by using the keyword search tool below to find specific information within the annual report.-
 1
1 -
2
-
3
-
4
-
5
-
6
-
7
-
8
-
9
-
10
-
11
-
12
-
13
-
14
-
15
-
16
-
17
-
18
-
19
-
20
-
21
-
22
-
23
-
24
-
25
-
26
-
27
-
28
-
29
-
30
-
31
-
32
-
33
-
34
-
35
-
36
-
37
-
38
-
39
-
40
-
41
-
42
-
43
-
44
-
45
-
46
-
47
-
48
-
49
-
50
-
51
-
52
-
53
-
54
-
55
-
56
-
57
-
58
-
59
-
60
-
61
-
62
-
63
-
64
-
65
-
66
-
67
-
68
-
69
-
70
-
71
-
72
-
73
-
74
-
75
-
76
-
77
-
78
-
79
-
80
-
81
-
82
-
83
-
84
-
85
-
86
-
87
-
88
-
89
-
90
-
91
-
92
-
93
-
94
-
95
-
 96
96 -
 97
97 -
 98
98 -
 99
99 -
 100
100 -
 101
101 -
 102
102 -
 103
103 -
 104
104 -
 105
105 -
 106
106 -
 107
107 -
 108
108 -
 109
109 -
 110
110 -
 111
111 -
 112
112 -
 113
113 -
 114
114 -
 115
115 -
 116
116 -
117
-
118
-
119
-
120
-
121
-
122
-
123
-
124
-
125
-
126
-
127
-
128
-
129
-
130
-
131
-
132
-
133
-
134
-
135
-
136
-
137
-
138
 |
 |

104 TOYOTA •Annual Report 2008 •
Financial Section
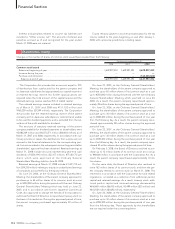
Toyota maintains a program to sell retail and lease finance
receivables. Under the program, Toyota’s securitization transac-
tions are generally structured as qualifying SPEs (“QSPE”s), thus
Toyota achieves sale accounting treatment under the provisions
of FAS 140. Toyota recognizes a gain or loss on the sale of the
finance receivables upon the transfer of the receivables to the
securitization trusts structured as a QSPE. Toyota retains servic-
ing rights and earns a contractual servicing fee of 1% per
annum on the total monthly outstanding principal balance of
the related securitized receivables. In a subordinated capacity,
Toyota retains interest-only strips, subordinated securities, and
cash reserve funds in these securitizations, and these retained
interests are held as restricted assets subject to limited recourse
provisions and provide credit enhancement to the senior
securities in Toyota’s securitization transactions. The retained
interests are not available to satisfy any obligations of Toyota.
Investors in the securitizations have no recourse to Toyota
beyond the contractual cash flows of the securitized receiv-
ables, retained subordinated interests, any cash reserve funds
and any amounts available or funded under the revolving liq-
uidity notes. Toyota’s exposure to these retained interests
exists until the associated securities are paid in full. Investors do
not have recourse to other assets held by Toyota for failure of
obligors on the receivables to pay when due or otherwise.
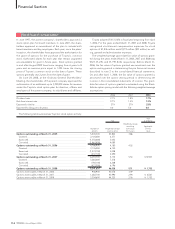
Toyota sold finance receivables under the program and rec-
ognized pretax gains resulting from these sales of ¥837 million,
¥1,589 million and ¥1,688 million ($17 million) for the years
ended March 31, 2006, 2007 and 2008, respectively, after pro-
viding an allowance for estimated credit losses. The gain on
sale recorded depends on the carrying amount of the assets at
the time of the sale. The carrying amount is allocated between
the assets sold and the retained interests based on their relative
During the year ended March 31, 2008, Toyota sold mortgage loan receivables, while no other retail and finance lease receivables
were securitized.
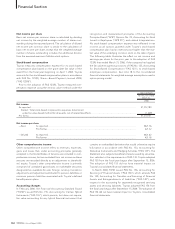
The following table summarizes certain cash flows received from and paid to the securitization trusts for the years ended March 31,
2006, 2007 and 2008.
U.S. dollars
Yen in millions in millions
For the year ended
For the years ended March 31, March 31,
2006 2007 2008 2008
Proceeds from new securitizations, net of purchased and retained securities..... ¥ 88,698 ¥69,018 ¥91,385 $912
Servicing fees received.............................................................................................. 2,297 1,881 1,682 17
Excess interest received from interest only strips ................................................... 4,219 2,818 1,865 19
Repurchases of receivables....................................................................................... (50,086) — (4,681) (47)
Servicing advances..................................................................................................... (453) (234) (114) (1)
Reimbursement of servicing and maturity advances .............................................. 793 234 114 1
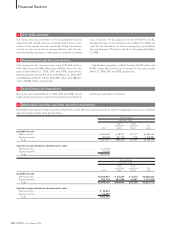
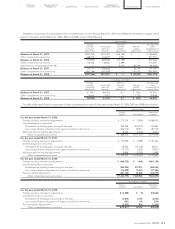
The contractual maturities of retail receivables, the future minimum lease payments on finance leases and wholesale and other dealer
loans at March 31, 2008 are summarized as follows:
Yen in millions U.S. dollars in millions
Wholesale Wholesale
Finance and other Finance and other
Years ending March 31, Retail lease dealer loans Retail lease dealer loans
2009 ..................................................................... ¥1,992,899 ¥272,261 ¥2,109,716 $19,891 $2,718 $21,057
2010 ..................................................................... 1,744,911 195,266 143,833 17,416 1,949 1,436
2011 ..................................................................... 1,442,464 173,664 104,150 14,398 1,733 1,040
2012 ..................................................................... 965,618 74,552 75,085 9,638 744 749
2013 ..................................................................... 530,228 21,607 72,583 5,292 216 724
Thereafter............................................................ 283,359 1,436 99,044 2,828 14 989
¥6,959,479 ¥738,786 ¥2,604,411 $69,463 $7,374 $25,995
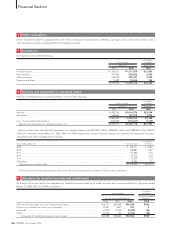
Finance leases consist of the following:
U.S. dollars
Yen in millions in millions
March 31, March 31,
2007 2008 2008
Minimum lease payments ................................................................................................................. ¥ 679,311 ¥738,786 $ 7,374
Estimated unguaranteed residual values......................................................................................... 382,427 421,615 4,208
1,061,738 1,160,401 11,582
Deferred origination costs ................................................................................................................ 3,348 4,414 44
Less—Unearned income ................................................................................................................... (100,035) (118,831) (1,186)
Less—Allowance for credit losses .................................................................................................... (4,999) (4,592) (46)
Finance leases, net ........................................................................................................................ ¥ 960,052 ¥1,041,392 $10,394