Toyota 2008 Annual Report Download - page 36
Download and view the complete annual report
Please find page 36 of the 2008 Toyota annual report below. You can navigate through the pages in the report by either clicking on the pages listed below, or by using the keyword search tool below to find specific information within the annual report.-
 1
1 -
2
-
3
-
4
-
5
-
6
-
7
-
8
-
9
-
10
-
11
-
12
-
13
-
14
-
15
-
16
-
17
-
18
-
19
-
20
-
21
-
22
-
23
-
24
-
25
-
 26
26 -
 27
27 -
 28
28 -
 29
29 -
 30
30 -
 31
31 -
 32
32 -
 33
33 -
 34
34 -
 35
35 -
 36
36 -
 37
37 -
 38
38 -
 39
39 -
 40
40 -
 41
41 -
 42
42 -
 43
43 -
 44
44 -
 45
45 -
 46
46 -
47
-
48
-
49
-
50
-
51
-
52
-
53
-
54
-
55
-
56
-
57
-
58
-
59
-
60
-
61
-
62
-
63
-
64
-
65
-
66
-
67
-
68
-
69
-
70
-
71
-
72
-
73
-
74
-
75
-
76
-
77
-
78
-
79
-
80
-
81
-
82
-
83
-
84
-
85
-
86
-
87
-
88
-
89
-
90
-
91
-
92
-
93
-
94
-
95
-
96
-
97
-
98
-
99
-
100
-
101
-
102
-
103
-
104
-
105
-
106
-
107
-
108
-
109
-
110
-
111
-
112
-
113
-
114
-
115
-
116
-
117
-
118
-
119
-
120
-
121
-
122
-
123
-
124
-
125
-
126
-
127
-
128
-
129
-
130
-
131
-
132
-
133
-
134
-
135
-
136
-
137
-
138
 |
 |
34 TOYOTA •Annual Report 2008 •
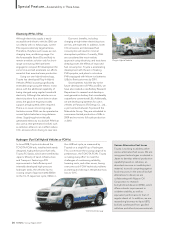
Business Overview
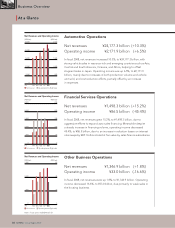
At a Glance
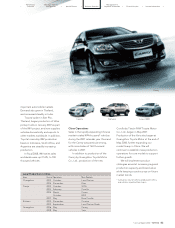
Automotive Operations
Net revenues ¥24,177.3 billion (+10.3%)
Operating income ¥2,171.9 billion (+6.5%)
In fiscal 2008, net revenues increased 10.3%, to ¥24,177.3 billion, with
strong vehicle sales in resource-rich and emerging countries such as Asia,
Central and South America, Oceania, and Africa, helping to offset
stagnant sales in Japan. Operating income was up 6.5%, to ¥2,171.9
billion, mainly due to increases in both production volume and vehicle
unit sold, and cost reduction efforts, partially offset by an increase
in expenses.
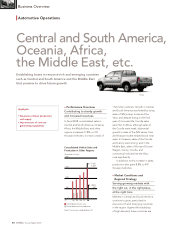
Financial Services Operations
Net revenues ¥1,498.3 billion (+15.2%)
Operating income ¥86.5 billion (-45.4%)
In fiscal 2008, net revenues grew 15.2%, to ¥1,498.3 billion, due to
aggressive efforts to expand auto sales financing. Meanwhile despite
a steady increase in financing volume, operating income decreased
45.4%, to ¥86.5 billion, due to an increase in valuation losses on interest
rate swaps by ¥48.1 billion stated at fair value by sales finance subsidiaries.
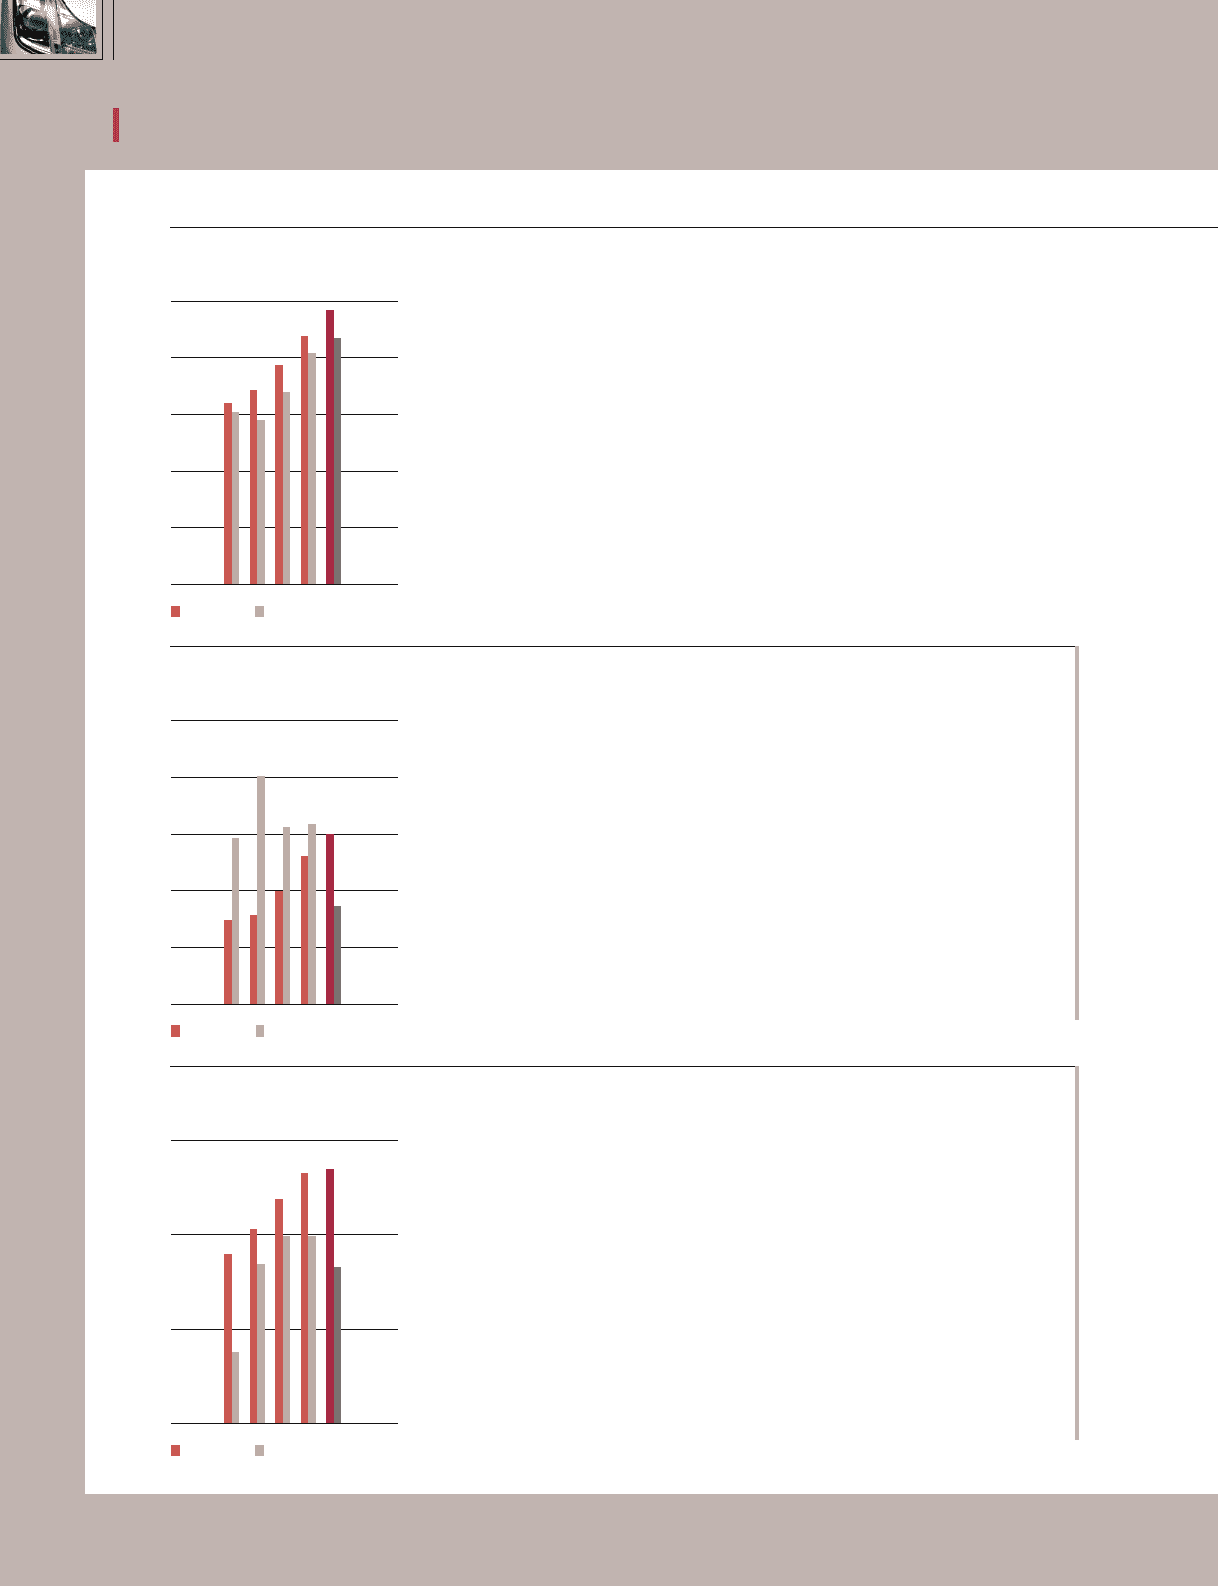
Other Business Operations
Net revenues ¥1,346.9 billion (+1.8%)
Operating income ¥33.0 billion (-16.6%)
In fiscal 2008, net revenues were up 1.8%, to ¥1,346.9 billion. Operating
income decreased 16.6%, to ¥33.0 billion, due primarily to weak sales in
the housing business.
’04 ’05 ’06 ’07 ’08
0
10,000
20,000
25,000
(¥ Billion)
0
1,000
15,000 1,500
5,000 500
2,000
2,500
(¥ Billion)
Net revenues Operating income (Right scale)
FY
Net Revenues and Operating Income
’04 ’05 ’06 ’07 ’08
0
1,000
1,500
2,500
2,000
0
100
500 50
150
200
250
(¥ Billion) (¥ Billion)
Net revenues Operating income (Right scale)
FY
Net Revenues and Operating Income
’04 ’05 ’06 ’07 ’08
0
1,000
1,500
0
500 20
40
60
(¥ Billion) (¥ Billion)
Net revenues Operating income (Right scale)
FY
Net Revenues and Operating Income
Note: Fiscal years ended March 31