Toyota 2008 Annual Report Download - page 130
Download and view the complete annual report
Please find page 130 of the 2008 Toyota annual report below. You can navigate through the pages in the report by either clicking on the pages listed below, or by using the keyword search tool below to find specific information within the annual report.-
 1
1 -
2
-
3
-
4
-
5
-
6
-
7
-
8
-
9
-
10
-
11
-
12
-
13
-
14
-
15
-
16
-
17
-
18
-
19
-
20
-
21
-
22
-
23
-
24
-
25
-
26
-
27
-
28
-
29
-
30
-
31
-
32
-
33
-
34
-
35
-
36
-
37
-
38
-
39
-
40
-
41
-
42
-
43
-
44
-
45
-
46
-
47
-
48
-
49
-
50
-
51
-
52
-
53
-
54
-
55
-
56
-
57
-
58
-
59
-
60
-
61
-
62
-
63
-
64
-
65
-
66
-
67
-
68
-
69
-
70
-
71
-
72
-
73
-
74
-
75
-
76
-
77
-
78
-
79
-
80
-
81
-
82
-
83
-
84
-
85
-
86
-
87
-
88
-
89
-
90
-
91
-
92
-
93
-
94
-
95
-
96
-
97
-
98
-
99
-
100
-
101
-
102
-
103
-
104
-
105
-
106
-
107
-
108
-
109
-
110
-
111
-
112
-
113
-
114
-
115
-
116
-
117
-
118
-
119
-
 120
120 -
 121
121 -
 122
122 -
 123
123 -
 124
124 -
 125
125 -
 126
126 -
 127
127 -
 128
128 -
 129
129 -
 130
130 -
 131
131 -
 132
132 -
 133
133 -
 134
134 -
 135
135 -
 136
136 -
 137
137 -
 138
138
 |
 |

128 TOYOTA •Annual Report 2008 •
Financial Section
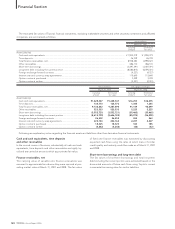
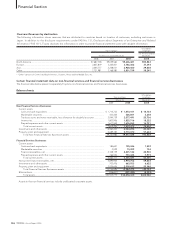
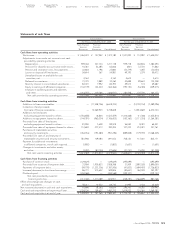
Statements of income
U.S. dollars
Yen in millions in millions
For the year ended
For the years ended March 31, March 31,
2006 2007 2008 2008
Non-Financial Services Businesses
Net revenues ................................................................................................. ¥20,068,284 ¥22,679,078 ¥24,831,172 $247,841
Costs and expenses
Cost of revenues ....................................................................................... 16,335,340 18,361,641 20,459,061 204,203
Selling, general and administrative ......................................................... 1,993,528 2,230,734 2,181,491 21,773
Total costs and expenses ..................................................................... 18,328,868 20,592,375 22,640,552 225,976
Operating income......................................................................................... 1,739,416 2,086,703 2,190,620 21,865
Other income, net......................................................................................... 201,978 145,570 176,417 1,761
Income before income taxes, minority interest
and equity in earnings of affiliated companies......................................... 1,941,394 2,232,273 2,367,037 23,626
Provision for income taxes ........................................................................... 736,909 844,797 889,660 8,880
Income before minority interest and equity in earnings
of affiliated companies ............................................................................... 1,204,485 1,387,476 1,477,377 14,746
Minority interest in consolidated subsidiaries ............................................ (82,401) (49,513) (73,543) (734)
Equity in earnings of affiliated companies.................................................. 142,139 193,130 268,025 2,675
Net income—Non-Financial Services Businesses ..................................... 1,264,223 1,531,093 1,671,859 16,687
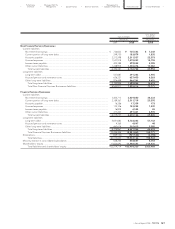
Financial Services Businesses
Net revenues ................................................................................................. 996,909 1,300,548 1,498,354 14,955
Costs and expenses
Cost of revenues ....................................................................................... 613,563 879,203 1,075,972 10,739
Selling, general and administrative ......................................................... 227,529 262,850 335,888 3,353
Total costs and expenses ..................................................................... 841,092 1,142,053 1,411,860 14,092
Operating income......................................................................................... 155,817 158,495 86,494 863
Other expense, net ....................................................................................... (9,859) (8,171) (16,265) (162)
Income before income taxes, minority interest
and equity in earnings of affiliated companies......................................... 145,958 150,324 70,229 701
Provision for income taxes ........................................................................... 58,241 53,548 21,904 219
Income before minority interest and equity in earnings
of affiliated companies ............................................................................... 87,717 96,776 48,325 482
Minority interest in consolidated subsidiaries ............................................ (1,992) (174) (4,419) (44)
Equity in earnings of affiliated companies.................................................. 22,227 16,385 2,089 21
Net income—Financial Services Businesses............................................... 107,952 112,987 45,995 459
Eliminations ................................................................................................... 5 (48) 25 0
Net income .................................................................................................... ¥ 1,372,180 ¥ 1,644,032 ¥1,717,879 $ 17,146