Toyota 2008 Annual Report Download - page 81
Download and view the complete annual report
Please find page 81 of the 2008 Toyota annual report below. You can navigate through the pages in the report by either clicking on the pages listed below, or by using the keyword search tool below to find specific information within the annual report.-
 1
1 -
2
-
3
-
4
-
5
-
6
-
7
-
8
-
9
-
10
-
11
-
12
-
13
-
14
-
15
-
16
-
17
-
18
-
19
-
20
-
21
-
22
-
23
-
24
-
25
-
26
-
27
-
28
-
29
-
30
-
31
-
32
-
33
-
34
-
35
-
36
-
37
-
38
-
39
-
40
-
41
-
42
-
43
-
44
-
45
-
46
-
47
-
48
-
49
-
50
-
51
-
52
-
53
-
54
-
55
-
56
-
57
-
58
-
59
-
60
-
61
-
62
-
63
-
64
-
65
-
66
-
67
-
68
-
69
-
70
-
 71
71 -
 72
72 -
 73
73 -
 74
74 -
 75
75 -
 76
76 -
 77
77 -
 78
78 -
 79
79 -
 80
80 -
 81
81 -
 82
82 -
 83
83 -
 84
84 -
 85
85 -
 86
86 -
 87
87 -
 88
88 -
 89
89 -
 90
90 -
 91
91 -
92
-
93
-
94
-
95
-
96
-
97
-
98
-
99
-
100
-
101
-
102
-
103
-
104
-
105
-
106
-
107
-
108
-
109
-
110
-
111
-
112
-
113
-
114
-
115
-
116
-
117
-
118
-
119
-
120
-
121
-
122
-
123
-
124
-
125
-
126
-
127
-
128
-
129
-
130
-
131
-
132
-
133
-
134
-
135
-
136
-
137
-
138
 |
 |
79
•Annual Report 2008 • TOYOTA
Performance Messages from the Management &
•Overview •Management •Special Feature •Business Overview •Corporate Information •Financial Section •Investor Information •
■
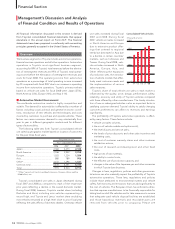
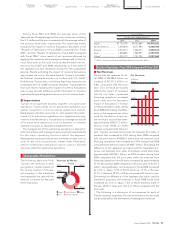
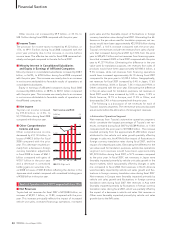
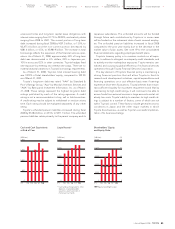
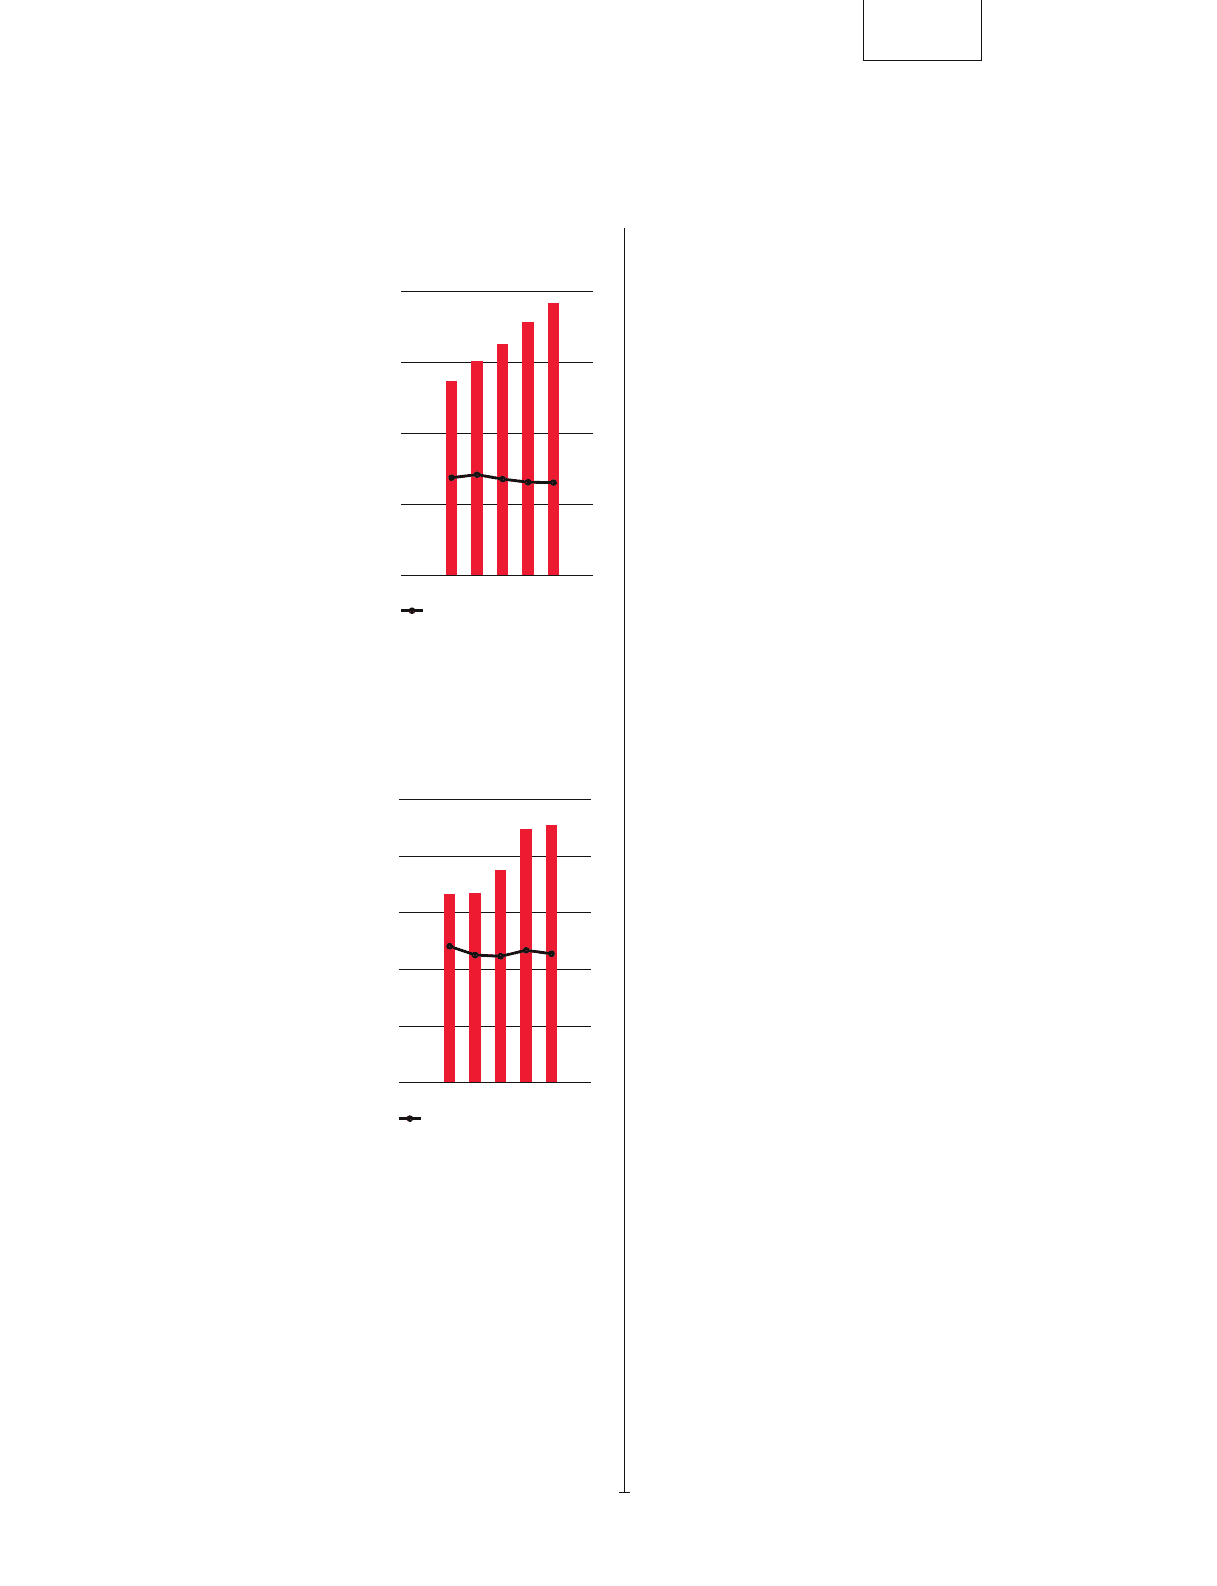
Research and development
expenses (included in cost of
products sold and selling, gen-
eral and administrative expens-
es) increased by ¥68.1 billion, or
7.6%, to ¥958.8 billion during fis-
cal 2008 compared with the prior
year. This increase primarily relates
to expenditures attributed to the
development of environmentally
conscious technologies includ-
ing hybrid and fuel-cell technolo-
gy, aggressive developments in
advanced technologies relating
to collision safety and vehicle
stability controls and the impact
of expanding new models to
promote Toyota’s strength in a
global market to further build up
competitive strength in the
future.
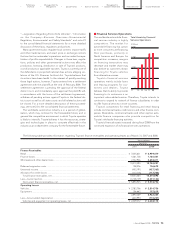
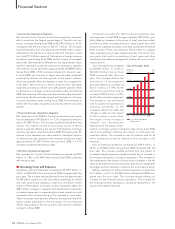
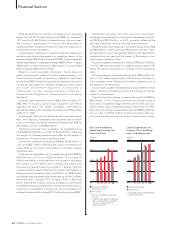
■Operating Income
Toyota’s operating income
increased by ¥31.7 billion, or
1.4%, to ¥2,270.3 billion during
fiscal 2008 compared with the
prior year. Operating income
was favorably affected by the
vehicle unit sales growth, the
changes in sales mix, the impact
of increased parts sales, contin-
ued cost reduction efforts and
the favorable impact of fluctua-
tions in foreign currency transla-
tion rates. These increases were
partially offset by increases in
research and development
expenses and the increases in
expenses due to business expan-
sion. As a result, operating
income decreased to 8.6% as a
percentage of net revenues for
fiscal 2008 compared to 9.3% in
the prior year.
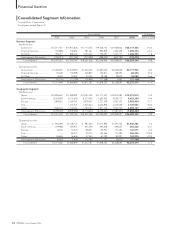
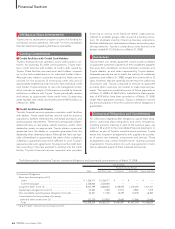
During fiscal 2008, operating income (before the elimination
of intersegment profits) for significant geographic regions
decreased by ¥16.9 billion, or 1.2%, in Japan, decreased by
¥144.3 billion, or 32.1%, in North America, increased by ¥4.2 bil-
lion, or 3.0% in Europe, increased by ¥138.8 billion, or 118.0%,
in Asia, and increased by ¥60.4 billion, or 72.4% in Other com-
pared with the prior year. The decrease in Japan was mainly
due to an increase in expenses including research and develop-
ment expenses, partially offset by the vehicle unit sales growth
in the export markets and continued cost reduction efforts. The
decrease in North America was mainly due to an increase in
valuation losses on interest rate swaps stated at fair value and
the impact of fluctuations in foreign currency translation rates
partially offset by the increase in production volume and vehicle
unit sales and continued cost reduction efforts in the manufac-
turing operations. The increases in Europe were mainly due to
the impact of an increase in production volume and vehicle unit
sales, continued cost reduction efforts in the manufacturing
operations and the favorable impact of fluctuations in foreign
currency translation rates. The increases in Asia were mainly
due to the impact of an increase in production volume and
vehicle unit sales. The increase in Other was primarily due to
the impact of the increase in production volume and vehicle
unit sales.
The following is a discussion of operating income for each of
Toyota’s business segments. The operating income amounts
discussed are before the elimination of intersegment profits.
• Automotive Operations Segment
Operating income from Toyota’s automotive operations
increased by ¥133.1 billion, or 6.5%, to ¥2,171.9 billion during
fiscal 2008 compared with the prior year. This increase is primar-
ily attributed to the increase in vehicle unit sales, the increase in
parts sales, the impact of continued cost reduction efforts and
the favorable impact of fluctuations in foreign currency transla-
tion rates. This increase was partially offset by the increase in
research and development expenses and the increase in
expenses due to business expansion.
• Financial Services Operations Segment
Operating income from Toyota’s financial services operations
decreased by ¥72.0 billion, or 45.4%, to ¥86.5 billion during fis-
cal 2008 compared with the prior year. This decrease is primarily
due to an increase in valuation losses on interest rate swaps
stated at fair value, partially offset by the impact of a higher vol-
ume of financing activities.
• All Other Operations Segment
Operating income from Toyota’s other businesses decreased
by ¥6.6 billion, or 16.6% to ¥33.0 billion during fiscal 2008 com-
pared with the prior year.
■Other Income and Expenses
Interest and dividend income increased by ¥33.7 billion, or
25.6%, to ¥165.7 billion during fiscal 2008 compared with the
prior year mainly due to an increase in interest income reflect-
ing an increase in marketable securities.
Interest expense decreased by ¥3.2 billion, or 6.5%, to ¥46.1
billion during fiscal 2008 compared with the prior year due to a
decrease in borrowings in the automotive operations segment.
Foreign exchange gains, net decreased by ¥23.8 billion, or
72.2%, to ¥9.2 billion during fiscal 2008 compared with the prior
year. Foreign exchange gains and losses include the differences
between the value of foreign currency denominated sales trans-
lated at prevailing exchange rates and the value of the sales
amounts settled during the year, including those settled using
forward foreign currency exchange contracts.
0
500
250
750
1,000
0
6
3
9
12
’04FY ’05 ’06 ’07 ’08
(¥ Billion) (%)
% of sales of products
(Right scale)
R&D Expenses
’04FY ’05 ’06 ’07 ’08
0
1,000
500
1,500
2,500
2,000
0
8
4
12
20
16
(¥ Billion) (%)
% of net revenues (Right scale)
Operating Income