Toyota 2008 Annual Report Download - page 125
Download and view the complete annual report
Please find page 125 of the 2008 Toyota annual report below. You can navigate through the pages in the report by either clicking on the pages listed below, or by using the keyword search tool below to find specific information within the annual report.-
 1
1 -
2
-
3
-
4
-
5
-
6
-
7
-
8
-
9
-
10
-
11
-
12
-
13
-
14
-
15
-
16
-
17
-
18
-
19
-
20
-
21
-
22
-
23
-
24
-
25
-
26
-
27
-
28
-
29
-
30
-
31
-
32
-
33
-
34
-
35
-
36
-
37
-
38
-
39
-
40
-
41
-
42
-
43
-
44
-
45
-
46
-
47
-
48
-
49
-
50
-
51
-
52
-
53
-
54
-
55
-
56
-
57
-
58
-
59
-
60
-
61
-
62
-
63
-
64
-
65
-
66
-
67
-
68
-
69
-
70
-
71
-
72
-
73
-
74
-
75
-
76
-
77
-
78
-
79
-
80
-
81
-
82
-
83
-
84
-
85
-
86
-
87
-
88
-
89
-
90
-
91
-
92
-
93
-
94
-
95
-
96
-
97
-
98
-
99
-
100
-
101
-
102
-
103
-
104
-
105
-
106
-
107
-
108
-
109
-
110
-
111
-
112
-
113
-
114
-
 115
115 -
 116
116 -
 117
117 -
 118
118 -
 119
119 -
 120
120 -
 121
121 -
 122
122 -
 123
123 -
 124
124 -
 125
125 -
 126
126 -
 127
127 -
 128
128 -
 129
129 -
 130
130 -
 131
131 -
 132
132 -
 133
133 -
 134
134 -
 135
135 -
136
-
137
-
138
 |
 |

123
•Annual Report 2008 • TOYOTA
Performance Messages from the Management &
•Overview •Management •Special Feature •Business Overview •Corporate Information •Financial Section •Investor Information •
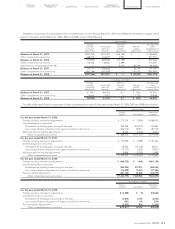
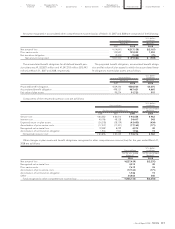
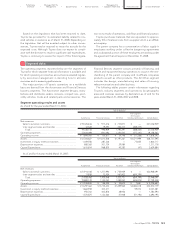
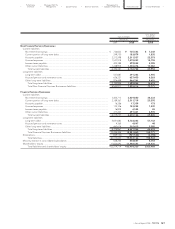
Segment operating results and assets
As of and for the year ended March 31, 2006:
Yen in millions
Inter-segment
Elimination/
Automotive Financial Services All Other Unallocated Amount Consolidated
Net revenues
Sales to external customers ............................................. ¥19,325,616 ¥ 977,416 ¥ 733,877 ¥ — ¥21,036,909
Inter-segment sales and transfers ................................... 12,528 19,493 456,414 (488,435) —
Total ............................................................................... 19,338,144 996,909 1,190,291 (488,435) 21,036,909
Operating expenses ............................................................. 17,644,099 841,092 1,150,543 (477,167) 19,158,567
Operating income................................................................. ¥ 1,694,045 ¥ 155,817 ¥ 39,748 ¥ (11,268) ¥ 1,878,342
Assets..................................................................................... ¥12,354,827 ¥11,613,508 ¥1,191,261 ¥3,571,999 ¥28,731,595
Investment in equity method investees .............................. 1,459,556 287,326 — 73,835 1,820,717
Depreciation expenses......................................................... 880,360 301,734 29,084 — 1,211,178
Capital Expenditure.............................................................. 1,615,814 968,835 45,282 (47) 2,629,884
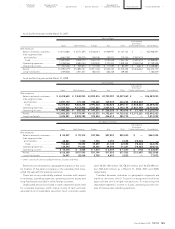
As of and for the year ended March 31, 2007:
Yen in millions
Inter-segment
Elimination/
Automotive Financial Services All Other Unallocated Amount Consolidated
Net revenues
Sales to external customers ............................................. ¥21,914,168 ¥ 1,277,994 ¥ 755,929 ¥ — ¥23,948,091
Inter-segment sales and transfers ................................... 13,838 22,554 567,802 (604,194) —
Total ............................................................................... 21,928,006 1,300,548 1,323,731 (604,194) 23,948,091
Operating expenses ............................................................. 19,889,178 1,142,053 1,284,052 (605,875) 21,709,408
Operating income................................................................. ¥ 2,038,828 ¥ 158,495 ¥ 39,679 ¥ 1,681 ¥ 2,238,683
Assets..................................................................................... ¥13,297,362 ¥13,735,434 ¥1,459,965 ¥4,082,018 ¥32,574,779
Investment in equity method investees .............................. 1,664,938 303,271 — 59,072 2,027,281
Depreciation expenses......................................................... 950,762 402,876 28,956 — 1,382,594
Capital Expenditure.............................................................. 1,570,875 1,122,564 47,948 (51,192) 2,690,195
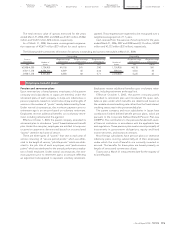
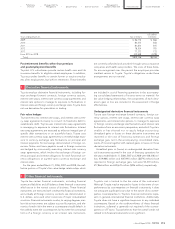
The operating segments reported below are the segments of
Toyota for which separate financial information is available and
for which operating income/loss amounts are evaluated regular-
ly by executive management in deciding how to allocate
resources and in assessing performance.
The major portions of Toyota’s operations on a worldwide
basis are derived from the Automotive and Financial Services
business segments. The Automotive segment designs, manu-
factures and distributes sedans, minivans, compact cars, sport-
utility vehicles, trucks and related parts and accessories. The
Financial Services segment consists primarily of financing, and
vehicle and equipment leasing operations to assist in the mer-
chandising of the parent company and its affiliate companies
products as well as other products. The All Other segment
includes the design, manufacturing and sales of housing,
telecommunications and other business.
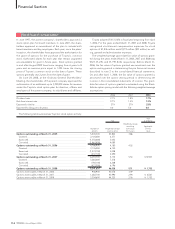
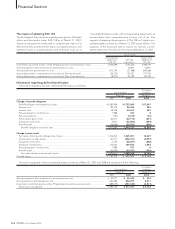
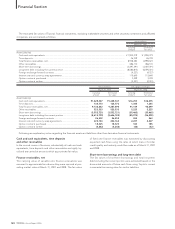
The following tables present certain information regarding
Toyota’s industry segments and operations by geographic
areas and overseas revenues by destination as of and for the
years ended March 31, 2006, 2007 and 2008.
Segment data:
24
.
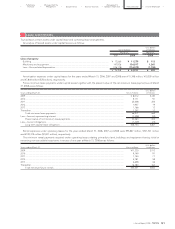
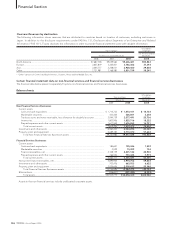
Based on the legislation that has been enacted to date,
Toyota has provided for its estimated liability related to cov-
ered vehicles in existence as of March 31, 2008. Depending on
the legislation that will be enacted subject to other circum-
stances, Toyota may be required to revise the accruals for the
expected costs. Although Toyota does not expect its compli-
ance with the directive to result in significant cash expenditures,
Toyota is continuing to assess the impact of this future legisla-
tion on its results of operations, cash flows and financial position.
Toyota purchases materials that are equivalent to approxi-
mately 10% of material costs from a supplier which is an affiliat-
ed company.
The parent company has a concentration of labor supply in
employees working under collective bargaining agreements
and a substantial portion of these employees are working under
the agreement that will expire on December 31, 2008.