Spirit Airlines 2015 Annual Report Download - page 78
Download and view the complete annual report
Please find page 78 of the 2015 Spirit Airlines annual report below. You can navigate through the pages in the report by either clicking on the pages listed below, or by using the keyword search tool below to find specific information within the annual report.-
 1
1 -
2
-
3
-
4
-
5
-
6
-
7
-
8
-
9
-
10
-
11
-
12
-
13
-
14
-
15
-
16
-
17
-
18
-
19
-
20
-
21
-
22
-
23
-
24
-
25
-
26
-
27
-
28
-
29
-
30
-
31
-
32
-
33
-
34
-
35
-
36
-
37
-
38
-
39
-
40
-
41
-
42
-
43
-
44
-
45
-
46
-
47
-
48
-
49
-
50
-
51
-
52
-
53
-
54
-
55
-
56
-
57
-
58
-
59
-
60
-
61
-
62
-
63
-
64
-
65
-
66
-
67
-
 68
68 -
 69
69 -
 70
70 -
 71
71 -
 72
72 -
 73
73 -
 74
74 -
 75
75 -
 76
76 -
 77
77 -
 78
78 -
 79
79 -
 80
80 -
 81
81 -
 82
82 -
 83
83 -
 84
84 -
 85
85 -
 86
86 -
 87
87 -
 88
88 -
89
-
90
-
91
-
92
-
93
-
94
-
95
-
96
-
97
-
98
-
99
-
100
-
101
-
102
-
103
-
104
-
105
 |
 |

Notes to Financial Statements—(Continued)
78
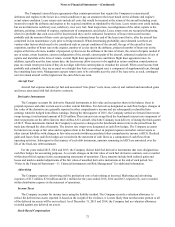
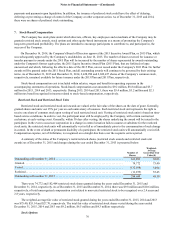
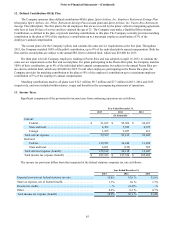
The grant date fair value of the performance share awards is determined through the use of a Monte Carlo simulation
model, which utilizes multiple input variables that determine the probability of satisfying the market condition requirements
applicable to each award as follows:
Weighted-Average at
Grant Date for Twelve
Months Ended
December 31, 2015
Weighted-Average at
Grant Date for Twelve
Months Ended
December 31, 2014
Expected volatility factor 0.36 0.42
Risk free interest rate 0.91 % 0.65 %
Expected term (in years) 2.55 2.77
Expected dividend yield — % — %
For grants awarded in 2015 and 2014, the volatility was based upon a weighted average historical volatility for the
Company. For grants awarded in 2013, the volatility was based upon a weighted average of the volatility for the Company and
the most recent volatility of the peer group as there was not sufficient historical data for the Company alone. The peer group
used to calculate volatility is consistent with the group used for the traditional employee stock options. The Company chose to
use historical volatility to value these awards because historical prices were used to develop the correlation coefficients
between the Company and each of the peer companies within the peer group in order to model stock price movements. The
volatilities used were calculated as the remaining term of the performance period at the date of grant. The risk-free interest rate
was based on the implied yield available on U.S. Treasury zero-coupon issues with remaining terms equivalent to the remaining
performance period. The Company does not intend to pay dividends on its common stock in the foreseeable future.
Accordingly, the Company used a dividend yield of zero in its model.
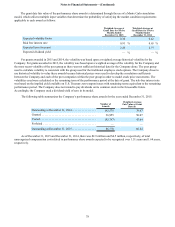
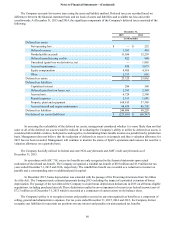
The following table summarizes the Company’s performance share awards for the year ended December 31, 2015:
Number of
Awards
Weighted-Average
Fair Value at Grant
Date ($)
Outstanding at December 31, 2014. . . . . . . . . . . . . . . . . 142,570 39.67
Granted . . . . . . . . . . . . . . . . . . . . . . . . . . . . . . . . . . . . . . 36,955 50.07
Vested . . . . . . . . . . . . . . . . . . . . . . . . . . . . . . . . . . . . . . . (92,747) 43.64
Forfeited . . . . . . . . . . . . . . . . . . . . . . . . . . . . . . . . . . . . . — —
Outstanding at December 31, 2015. . . . . . . . . . . . . . . . . 86,778 66.44
As of December 31, 2015 and December 31, 2014, there was $2.9 million and $4.5 million, respectively, of total
unrecognized compensation cost related to performance share awards expected to be recognized over 1.51 years and 1.64 years,
respectively.