Spirit Airlines 2015 Annual Report Download - page 47
Download and view the complete annual report
Please find page 47 of the 2015 Spirit Airlines annual report below. You can navigate through the pages in the report by either clicking on the pages listed below, or by using the keyword search tool below to find specific information within the annual report.-
 1
1 -
2
-
3
-
4
-
5
-
6
-
7
-
8
-
9
-
10
-
11
-
12
-
13
-
14
-
15
-
16
-
17
-
18
-
19
-
20
-
21
-
22
-
23
-
24
-
25
-
26
-
27
-
28
-
29
-
30
-
31
-
32
-
33
-
34
-
35
-
36
-
 37
37 -
 38
38 -
 39
39 -
 40
40 -
 41
41 -
 42
42 -
 43
43 -
 44
44 -
 45
45 -
 46
46 -
 47
47 -
 48
48 -
 49
49 -
 50
50 -
 51
51 -
 52
52 -
 53
53 -
 54
54 -
 55
55 -
 56
56 -
 57
57 -
58
-
59
-
60
-
61
-
62
-
63
-
64
-
65
-
66
-
67
-
68
-
69
-
70
-
71
-
72
-
73
-
74
-
75
-
76
-
77
-
78
-
79
-
80
-
81
-
82
-
83
-
84
-
85
-
86
-
87
-
88
-
89
-
90
-
91
-
92
-
93
-
94
-
95
-
96
-
97
-
98
-
99
-
100
-
101
-
102
-
103
-
104
-
105
 |
 |

47
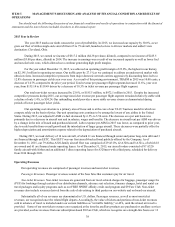
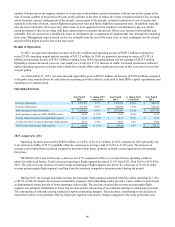
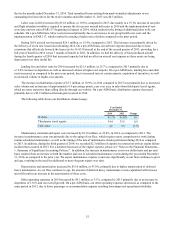
2014 compared to 2013
Operating revenues increased by $277.2 million, or 16.8%, to $1,931.6 million in 2014 compared to 2013, primarily due
to an increase in traffic of 18.0%, offset slightly by a decrease in average yield of 1.1% to 13.64 cents.
Our results for 2014 were driven by a capacity increase of 17.9% compared to 2013, while maintaining a high load factor
of 86.7%. TRASM for 2014 was 11.82 cents, a decrease of 1.0% compared to 2013, as a result of lower operating yields on
relatively stable load factors. Total revenue per passenger flight segment increased 1.4% from $133.27 in 2013 to $135.14 in
2014. The year-over-year increase in total revenue per passenger flight segment is due to higher non-ticket revenue per
passenger flight segment offset by lower ticket revenue per passenger flight segment.
During 2014, we increased our average non-ticket revenue per passenger flight segment by 2.2%, or $1.19, to $55.03. Our
total non-ticket revenue increased by 17.7%, or $118.2 million, to $786.6 million in 2014. The year-over-year increase in
average non-ticket revenue per passenger flight segment was primarily driven by a higher volume of passengers electing to
purchase seat assignments, largely due to a software update completed in 2014 that enables us to sell seat assignments through
more channels as well as a more rigorous approach to managing our seat inventory. Additionally, in July 2013, we increased
our passenger usage fee (PUF), helping to drive the increase in PUF fees year over year.
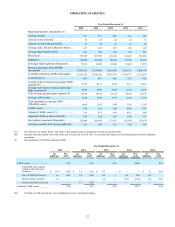
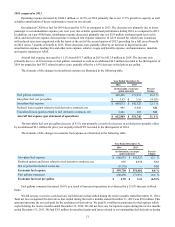
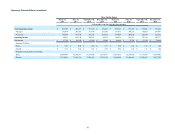
Operating Expenses
Since adopting our ULCC model, we have continuously sought to reduce our unit operating costs and have created one of
the industry's lowest cost structures in the United States. The table below presents our operating expenses, as a percentage of
operating revenue for the last three years, as well as unit operating costs (CASM).
Year Ended December 31,
2015 2014 2013
% of
Revenue CASM % of
Revenue CASM % of
Revenue CASM
Operating revenue 100.0% 100.0% 100.0%
Operating expenses:
Aircraft fuel (1) . . . . . . . . . . . . . . . . . . 21.5% 2.17¢ 31.7% 3.75¢ 33.4% 3.98¢
Salaries, wages and benefits. . . . . . . . . 17.7 1.78 16.3 1.92 15.8 1.89
Aircraft rent . . . . . . . . . . . . . . . . . . . . . 9.9 1.00 10.1 1.20 10.3 1.22
Landing fees and other rentals . . . . . . . 6.1 0.62 5.4 0.64 5.1 0.60
Distribution. . . . . . . . . . . . . . . . . . . . . . 4.0 0.41 3.9 0.46 4.1 0.49
Maintenance, materials and repairs . . . 3.8 0.38 3.8 0.45 3.6 0.43
Depreciation and amortization . . . . . . . 3.5 0.35 2.4 0.29 1.9 0.23
Other operating expenses . . . . . . . . . . . 9.7 0.97 7.7 0.92 8.7 1.04
Loss on disposal of assets. . . . . . . . . . . 0.1 0.01 0.2 0.02 — —
Special charges. . . . . . . . . . . . . . . . . . . — — — — — —
Total operating expense 76.2% 81.6% 82.9%
CASM . . . . . . . . . . . . . . . . . . . . . . . . . . . . . . 7.68¢ 9.65¢ 9.90¢
Adjusted CASM (2) 7.69 9.55 9.89
Adjusted CASM ex fuel (3) 5.50 5.88 5.91
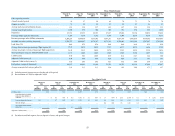
(1) Aircraft fuel expense is the sum of (i) “into-plane fuel cost,” which includes the cost of jet fuel and certain other charges such as fuel taxes and oil,
(ii) realized gains and losses related to fuel derivative contracts and (iii) unrealized gains and losses related to fuel derivative contracts. The
following table summarizes the components of aircraft fuel expense for the periods presented:
Year Ended December 31,
2015 2014 2013
(in thousands)
Into-plane fuel cost . . . . . . . . . . . . . . . . . . . . . . . . . . . . . . . . . . . . . . . . . . . . . . . . . . . . . . $ 454,747 $ 608,033 $ 542,523
Realized losses (gains) related to fuel derivative contracts, net . . . . . . . . . . . . . . . . . . . . 10,580 995 8,958
Unrealized losses (gains) related to fuel derivative contracts, net. . . . . . . . . . . . . . . . . . . (3,880) 3,881 265
Aircraft fuel . . . . . . . . . . . . . . . . . . . . . . . . . . . . . . . . . . . . . . . . . . . . . . . . . . . . . . . . . . . . $ 461,447 $ 612,909 $ 551,746