Spirit Airlines 2015 Annual Report Download - page 46
Download and view the complete annual report
Please find page 46 of the 2015 Spirit Airlines annual report below. You can navigate through the pages in the report by either clicking on the pages listed below, or by using the keyword search tool below to find specific information within the annual report.-
 1
1 -
2
-
3
-
4
-
5
-
6
-
7
-
8
-
9
-
10
-
11
-
12
-
13
-
14
-
15
-
16
-
17
-
18
-
19
-
20
-
21
-
22
-
23
-
24
-
25
-
26
-
27
-
28
-
29
-
30
-
31
-
32
-
33
-
34
-
35
-
 36
36 -
 37
37 -
 38
38 -
 39
39 -
 40
40 -
 41
41 -
 42
42 -
 43
43 -
 44
44 -
 45
45 -
 46
46 -
 47
47 -
 48
48 -
 49
49 -
 50
50 -
 51
51 -
 52
52 -
 53
53 -
 54
54 -
 55
55 -
 56
56 -
57
-
58
-
59
-
60
-
61
-
62
-
63
-
64
-
65
-
66
-
67
-
68
-
69
-
70
-
71
-
72
-
73
-
74
-
75
-
76
-
77
-
78
-
79
-
80
-
81
-
82
-
83
-
84
-
85
-
86
-
87
-
88
-
89
-
90
-
91
-
92
-
93
-
94
-
95
-
96
-
97
-
98
-
99
-
100
-
101
-
102
-
103
-
104
-
105
 |
 |

46
number of hours run on the engines, number of cycles run on the airframe, projected number of hours run on the engine at the
time of return, number of projected cycles run on the airframe at the time of return, the extent of repairs needed if any at return,
return locations, current configuration of the aircraft, current paint of the aircraft, estimated escalation of cost of repairs and
materials at the time of return, current flight hour agreement rates and future flight hour agreement rates. In addition, typically
near the lease return date, the lessors may allow reserves to be applied as return condition consideration or pass on certain
return provisions if they do not align with their current plans to remarket the aircraft. When costs become both probable and
estimable, they are accrued on a straight-line basis as contingent rent, a component of supplemental rent, through the remaining
lease term. Management expects return costs to be estimable near the end of the lease term, as such, contingent rent for related
aircraft will be higher near the end of the lease term.
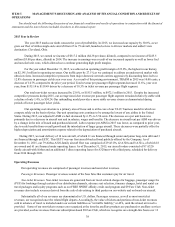
Results of Operations
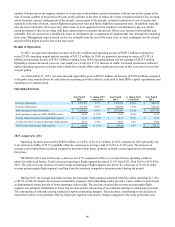
In 2015, we generated operating revenues of $2,141.5 million and operating income of $509.1 million resulting in a
record 23.8% operating margin and net earnings of $317.2 million. In 2014, we generated operating revenues of $1,931.6
million and operating income of $355.3 million resulting in an 18.4% operating margin and net earnings of $225.5 million.
Operating revenues increased year over year mainly as a result of a 27.1% increase in traffic. Increased operations resulted in
higher operating expenses across the board which were mostly offset with a significant decrease in fuel costs due to lower fuel
cost per gallon.
As of December 31, 2015, our cash and cash equivalents grew to $803.6 million, an increase of $170.8 million compared
to the prior year, mainly driven by cash from our operating activities offset by cash used to fund PDPs, capital expenditures and
repurchases of common stock.
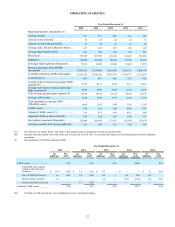
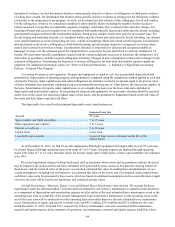
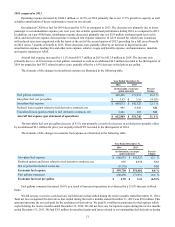
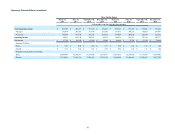
Operating Revenues
Year Ended
2015 % change 2015
versus 2014 Year Ended
2014 % change 2014
versus 2013 Year Ended
2013
Passenger (thousands). . . . . . . . . . . . . . . . . . . . . . . . . . . . . . $ 1,169,338 2.1% $ 1,144,972 16.1% $ 986,018
Non-ticket (thousands) . . . . . . . . . . . . . . . . . . . . . . . . . . . . . 972,125 23.6% 786,608 17.7% 668,367
Total operating revenue (thousands). . . . . . . . . . . . . . . . . . . $ 2,141,463 10.9% $ 1,931,580 16.8% $ 1,654,385
Total operating revenue per ASM (TRASM) (cents) . . . . . . 10.08 (14.7)% 11.82 (1.0)% 11.94
Average ticket revenue per passenger flight segment. . . . . . $ 65.25 (18.5)% $ 80.11 0.9% $ 79.43
Average non-ticket revenue per passenger flight segment . . 54.24 (1.4)% 55.03 2.2% 53.84
Total revenue per passenger flight segment . . . . . . . . . . . . . $ 119.49 (11.6)% $ 135.14 1.4% $ 133.27
2015 compared to 2014
Operating revenues increased by $209.9 million, or 10.9%, to $2,141.5 million in 2015 compared to 2014, primarily due
to an increase in traffic of 27.1%, partially offset by a decrease in average yield of 12.8% to 11.90 cents. The decrease in
average yield resulted from increased competitive pressures from major domestic network carriers aggressively discounting
fare prices.
TRASM for 2015 was 10.08 cents, a decrease of 14.7% compared to 2014, as a result of lower operating yields on
relatively stable load factors. Total revenue per passenger flight segment decreased 11.6% from $135.14 in 2014 to $119.49 in
2015. The year-over-year decrease in total revenue per passenger flight segment was driven by a decrease of 18.5% in ticket
revenue per passenger flight segment, resulting from the increased competitive pressures noted during the period.
During 2015, our average non-ticket revenue per passenger flight segment remained relatively stable, declining by 1.4%,
or $0.79, to $54.24, despite the increased competitive pressures. Our unbundling model provides a more stable revenue stream
as demonstrated during periods of lower passenger ticket yields. The decrease in non-ticket revenue per passenger flight
segment was primarily attributable to lower bag revenue and the outsourcing of our onboard catering to a third-party provider.
The outsourcing of onboard catering resulted in improved operating margins. These declines, contributing to the decrease in
non-ticket revenue, were partially offset by higher per segment convenience charges compared to the same period last year.