Spirit Airlines 2015 Annual Report Download - page 55
Download and view the complete annual report
Please find page 55 of the 2015 Spirit Airlines annual report below. You can navigate through the pages in the report by either clicking on the pages listed below, or by using the keyword search tool below to find specific information within the annual report.-
 1
1 -
2
-
3
-
4
-
5
-
6
-
7
-
8
-
9
-
10
-
11
-
12
-
13
-
14
-
15
-
16
-
17
-
18
-
19
-
20
-
21
-
22
-
23
-
24
-
25
-
26
-
27
-
28
-
29
-
30
-
31
-
32
-
33
-
34
-
35
-
36
-
37
-
38
-
39
-
40
-
41
-
42
-
43
-
44
-
 45
45 -
 46
46 -
 47
47 -
 48
48 -
 49
49 -
 50
50 -
 51
51 -
 52
52 -
 53
53 -
 54
54 -
 55
55 -
 56
56 -
 57
57 -
 58
58 -
 59
59 -
 60
60 -
 61
61 -
 62
62 -
 63
63 -
 64
64 -
 65
65 -
66
-
67
-
68
-
69
-
70
-
71
-
72
-
73
-
74
-
75
-
76
-
77
-
78
-
79
-
80
-
81
-
82
-
83
-
84
-
85
-
86
-
87
-
88
-
89
-
90
-
91
-
92
-
93
-
94
-
95
-
96
-
97
-
98
-
99
-
100
-
101
-
102
-
103
-
104
-
105
 |
 |

55
Three Months Ended
March 31,
2014 June 30,
2014 September 30,
2014 December 31,
2014 March 31,
2015 June 30,
2015 September 30,
2015 December 31,
2015
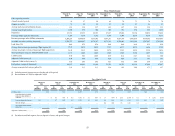
Other operating statistics
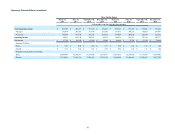
Aircraft at end of period . . . . . . . . . . . . . . . . . . . . . . . . . . . . . . . . . . 56 57 58 65 70 73 76 79
Airports served (1). . . . . . . . . . . . . . . . . . . . . . . . . . . . . . . . . . . . . . . 53 54 55 53 55 57 56 53
Average daily Aircraft utilization (hours). . . . . . . . . . . . . . . . . . . . . 12.8 12.8 12.7 12.5 12.7 12.9 12.8 12.5
Average stage length (miles). . . . . . . . . . . . . . . . . . . . . . . . . . . . . . . 1,000 976 964 983 991 974 983 1,000
Departures 23,561 25,353 26,513 27,167 29,044 32,164 34,032 33,662
Passenger flight segments (thousands) . . . . . . . . . . . . . . . . . . . . . . . 3,264 3,569 3,752 3,709 3,980 4,514 4,776 4,651
Revenue passenger miles (RPMs) (thousands) 3,289,287 3,506,459 3,656,842 3,707,271 4,017,559 4,481,064 4,768,692 4,727,996
Available seat miles (ASMs) (thousands) . . . . . . . . . . . . . . . . . . . . . 3,784,727 4,008,507 4,174,397 4,372,511 4,729,463 5,213,299 5,597,997 5,705,398
Load factor (%) 86.9 87.5 87.6 84.8 84.9 86.0 85.2 82.9
Average ticket revenue per passenger flight segment ($) . . . . . . . . . 77.79 84.75 84.50 73.21 68.71 68.35 66.96 57.52
Average non-ticket revenue per passenger flight segment ($) 56.41 55.15 54.04 54.70 55.25 54.24 53.39 54.26
Total operating revenue per ASM (TRASM) (cents) . . . . . . . . . . . . 11.57 12.46 12.45 10.85 10.43 10.62 10.27 9.11
CASM (cents) 9.99 9.83 10.05 8.79 8.12 8.27 7.46 7.00
Adjusted CASM (cents) (2). . . . . . . . . . . . . . . . . . . . . . . . . . . . . . . . 9.98 9.80 9.80 8.69 8.06 8.33 7.45 7.03
Adjusted CASM ex fuel (cents) (3) 6.06 5.95 5.92 5.61 5.72 5.80 5.39 5.15
Fuel gallons consumed (thousands) . . . . . . . . . . . . . . . . . . . . . . . . . 46,677 49,401 51,688 52,732 56,723 63,134 67,684 67,467
Average economic fuel cost per gallon ($) 3.18 3.13 3.13 2.56 1.95 2.08 1.71 1.57
(1) Includes seasonal airports not served at the end of the period.
(2) Reconciliation of CASM to Adjusted CASM:
Three Months Ended
March 31,
2014 June 30,
2014 September 30,
2014 December 31,
2014 March 31,
2015 June 30,
2015 September 30,
2015 December 31,
2015
(in
millions) Per
ASM (in
millions) Per
ASM (in
millions) Per
ASM (in
millions) Per
ASM (in
millions) Per
ASM (in
millions) Per
ASM (in
millions) Per
ASM (in
millions) Per
ASM
CASM (cents) ................................ 9.99 9.83 10.05 8.79 8.12 8.27 7.46 7.00
Unrealized losses (gains)
related to fuel derivative
contracts............................... $ — — $ 0.5 0.01 $ 0.3 0.01 $ 3.1 0.07 $ 1.7 0.04 $ (3.7) (0.07) $ 0.1 — $ (2.0) (0.03)
Loss on disposal of assets.... 0.2 — 0.7 0.02 0.8 0.02 1.3 0.03 0.6 0.01 0.4 0.01 0.3 0.01 0.3 0.01
Special charges .................... — — — — — — — — 0.4 0.01 0.3 0.01 0.1 — — —
Out of period fuel federal
excise tax ............................. ————9.30.22——————————
Adjusted CASM (cents)................. 9.98 9.80 9.80 8.69 8.06 8.33 7.45 7.03
(3) Excludes aircraft fuel expense, loss on disposal of assets, and special charges.