Spirit Airlines 2015 Annual Report Download - page 38
Download and view the complete annual report
Please find page 38 of the 2015 Spirit Airlines annual report below. You can navigate through the pages in the report by either clicking on the pages listed below, or by using the keyword search tool below to find specific information within the annual report.-
 1
1 -
2
-
3
-
4
-
5
-
6
-
7
-
8
-
9
-
10
-
11
-
12
-
13
-
14
-
15
-
16
-
17
-
18
-
19
-
20
-
21
-
22
-
23
-
24
-
25
-
26
-
27
-
 28
28 -
 29
29 -
 30
30 -
 31
31 -
 32
32 -
 33
33 -
 34
34 -
 35
35 -
 36
36 -
 37
37 -
 38
38 -
 39
39 -
 40
40 -
 41
41 -
 42
42 -
 43
43 -
 44
44 -
 45
45 -
 46
46 -
 47
47 -
 48
48 -
49
-
50
-
51
-
52
-
53
-
54
-
55
-
56
-
57
-
58
-
59
-
60
-
61
-
62
-
63
-
64
-
65
-
66
-
67
-
68
-
69
-
70
-
71
-
72
-
73
-
74
-
75
-
76
-
77
-
78
-
79
-
80
-
81
-
82
-
83
-
84
-
85
-
86
-
87
-
88
-
89
-
90
-
91
-
92
-
93
-
94
-
95
-
96
-
97
-
98
-
99
-
100
-
101
-
102
-
103
-
104
-
105
 |
 |
38
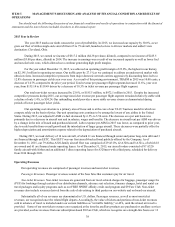
ITEM 7. MANAGEMENT’S DISCUSSION AND ANALYSIS OF FINANCIAL CONDITION AND RESULTS OF
OPERATIONS
You should read the following discussion of our financial condition and results of operations in conjunction with the financial
statements and the notes thereto included elsewhere in this annual report.
2015 Year in Review
The year 2015 marks our ninth consecutive year of profitability. In 2015, we increased our capacity by 30.0%, as we
grew our fleet of Airbus single-aisle aircraft from 65 to 79 aircraft, launched service to 40 new markets and added 1 new
destination: Cleveland, Ohio.
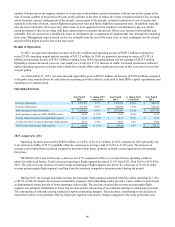
During 2015, we earned net income of $317.2 million ($4.38 per share, diluted), compared to net income of $225.5
million ($3.08 per share, diluted) in 2014. The increase in earnings was a result of our increased capacity as well as lower fuel
and non-fuel unit costs, which allowed us to continue generating high profit margins.
For the year ended December 31, 2015, we achieved an operating profit margin of 23.8%, the highest in our history,
on $2,141.5 million in operating revenues. Our traffic grew by 27.1% as we continued to address an underserved market with
ultra-low fares. Increased competitive pressures from major domestic network carriers aggressively discounting fares led to a
12.8% decrease in passenger yields year over year. As a result of this pricing environment, TRASM in 2015 was 10.08 cents, a
decrease of 14.7% compared to the prior year period. Total revenue per passenger flight segment decreased 11.6%, year over
year, from $135.14 to $119.49 driven by a decrease of 18.5% in ticket revenue per passenger flight segment.
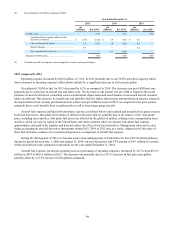
Our total non-ticket revenue increased by 23.6%, or $185.5 million, to $972.1 million in 2015. Despite the increased
competitive pressures during 2015, our average non-ticket revenue per passenger flight segment remained relatively stable with
a decline of only 1.4%, to $54.24. Our unbundling model provides a more stable revenue stream as demonstrated during
periods of lower passenger ticket yields.
Our operating cost structure is a primary area of focus and is at the core of our ULCC business model in which we
compete solely on the basis of price. Our unit operating costs continue to be among the lowest of any airline in the United
States. During 2015, our adjusted CASM ex-fuel decreased by 6.5% to 5.50 cents. The decrease on a per unit basis was
primarily due to a decrease in aircraft rent and in salaries, wages and benefits. The decrease in aircraft rent per ASM was driven
by a change in the mix of leased and purchased aircraft. Labor expense per ASM in 2015 was lower, as compared to prior year,
due to scale benefits from overall growth and the introduction of larger gauge aircraft. These decreases were partially offset by
higher depreciation and amortization expense related to the depreciation of purchased aircraft.
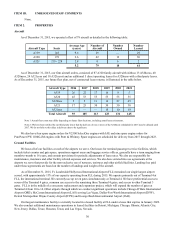
During 2015, we took delivery of 14 new aircraft, of which 11 are financed through senior and junior long-term debt and 3
are financed through an EETC. This EETC was our first aircraft-backed bond publicly offered by the Company. As of
December 31, 2015, our 79 Airbus A320-family aircraft fleet was comprised of 29 A319s, 42 A320s and 8 A321s, of which 18
are owned and 61 are financed under operating leases. As of December 31, 2015, our aircraft orders consisted of 87 A320
family aircraft with Airbus and an additional 5 direct operating leases for A320neos with a third party, scheduled for delivery
from 2016 through 2021.
Operating Revenues
Our operating revenues are comprised of passenger revenues and non-ticket revenues.
Passenger Revenues. Passenger revenues consist of the base fares that customers pay for air travel.
Non-ticket Revenues. Non-ticket revenues are generated from air travel-related charges for baggage, passenger usage fee
(PUF) for bookings through certain of our distribution channels, advance seat selection, itinerary changes, hotel and rental car
travel packages and loyalty programs such as our FREE SPIRIT affinity credit card program and $9 Fare Club. Non-ticket
revenues also include revenues derived from the sale of advertising to third parties on our website and on board our aircraft.
Substantially all of our revenues are denominated in U.S. dollars. Passenger revenues, as well as most non-ticket
revenues, are recognized once the related flight departs. Accordingly, the value of tickets and portions of non-ticket revenues
sold in advance of travel is included under our current liabilities as “air traffic liability,” or ATL, until the related air travel is
provided. Some of our non-ticket revenues are recognized at the time the ancillary products are purchased or ancillary services
are provided, such as revenues from our subscription-based $9 Fare Club, which we recognize on a straight-line basis over 12