Spirit Airlines 2015 Annual Report Download - page 41
Download and view the complete annual report
Please find page 41 of the 2015 Spirit Airlines annual report below. You can navigate through the pages in the report by either clicking on the pages listed below, or by using the keyword search tool below to find specific information within the annual report.-
 1
1 -
2
-
3
-
4
-
5
-
6
-
7
-
8
-
9
-
10
-
11
-
12
-
13
-
14
-
15
-
16
-
17
-
18
-
19
-
20
-
21
-
22
-
23
-
24
-
25
-
26
-
27
-
28
-
29
-
30
-
 31
31 -
 32
32 -
 33
33 -
 34
34 -
 35
35 -
 36
36 -
 37
37 -
 38
38 -
 39
39 -
 40
40 -
 41
41 -
 42
42 -
 43
43 -
 44
44 -
 45
45 -
 46
46 -
 47
47 -
 48
48 -
 49
49 -
 50
50 -
 51
51 -
52
-
53
-
54
-
55
-
56
-
57
-
58
-
59
-
60
-
61
-
62
-
63
-
64
-
65
-
66
-
67
-
68
-
69
-
70
-
71
-
72
-
73
-
74
-
75
-
76
-
77
-
78
-
79
-
80
-
81
-
82
-
83
-
84
-
85
-
86
-
87
-
88
-
89
-
90
-
91
-
92
-
93
-
94
-
95
-
96
-
97
-
98
-
99
-
100
-
101
-
102
-
103
-
104
-
105
 |
 |
41
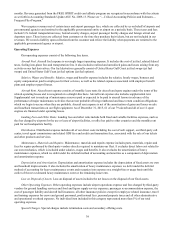
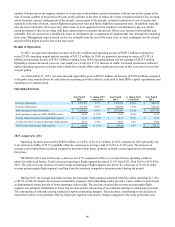
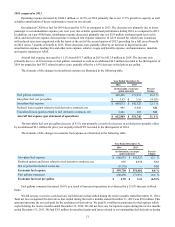
During the second quarter of 2012, we paid $27.2 million, or 90% of the 2011 tax savings realized from the utilization of
NOLs, including $0.3 million of applicable interest, to the Pre-IPO Stockholders.
During 2013, we filed an amended 2009 income tax return which resulted in a reduction to the estimated TRA liability
from $8.0 million to $5.6 million. On September 13, 2013, we filed our 2012 federal income tax return, and on October 14,
2013, we submitted a Tax Benefit Schedule to the Stockholder Representatives. On November 27, 2013, pursuant to the TRA,
we received an objection notice to the Tax Benefit Schedule from the Stockholder Representatives. On April 7, 2014, we
received a demand for arbitration from the Stockholder Representatives. Prior to commencing arbitration proceedings, on June
17, 2014, we and Stockholder Representatives agreed on a settlement amount of $7.0 million in addition to interest of $0.3
million. The agreed upon settlement was in excess of the outstanding liability of $5.6 million at the time of settlement. The
excess payment of $1.4 million was recorded within other expense in the statement of operations and recorded as cash from
operations in the statement of cash flows. We have made all payments in accordance with the agreed upon settlement terms and
have no outstanding obligations related to the TRA.
Trends and Uncertainties Affecting Our Business
We believe our operating and business performance is driven by various factors affecting airlines and their markets,
trends affecting the broader travel industry and trends affecting the specific markets and customer base that we target. The
following key factors may affect our future performance.
Competition. The airline industry is highly competitive. The principal competitive factors in the airline industry are fare
pricing, total price, flight schedules, aircraft type, passenger amenities, number of routes served from a city, customer service,
safety record, reputation, code-sharing relationships, frequent flier programs and redemption opportunities. Price competition
occurs on a market-by-market basis through price discounts, changes in pricing structures, fare matching, target promotions and
frequent flier initiatives. Airlines typically use discount fares and other promotions to stimulate traffic during normally slower
travel periods to generate cash flow and to maximize unit revenue. The prevalence of discount fares can be particularly acute
when a competitor has excess capacity that it is under financial pressure to sell.
In 2015, the airline industry saw greater and more persistent price discounting than in the preceding several years. A
major reason enabling price discounting was the sharp decline in petroleum prices on world markets during the last couple
years, which increased airline profitability and more than offset general increases in non-fuel costs. In addition, significant
airline capacity increases in certain major cities - such as Dallas and Chicago - exerted strong downward price pressure in those
markets. Finally, beginning in mid-2015 network carriers began seeking to match low-cost carrier and ULCC pricing on
portions of their marginal unsold capacity, particularly in their key hub markets.
Absent significant increases in fuel prices and more constrained capacity, we expect the discounting trend to continue for
the foreseeable future. Moreover, the network carriers have developed, or are in process of developing, a fare-class pricing
approach, in which a portion of available seats may be sold at or near ULCC prices, but without most product features available
to their passengers paying at higher fare levels on the same flight. Broad fare discounting can have the effect of diluting the
profitability of revenues of network carriers, which have units costs significantly above those of ULCCs, but the fare-class
approach may allow network carriers to continue offering a competitive price to ULCCs on some flights or routes, while
maintaining higher pricing to their traditional constituencies of business and more affluent travelers.
Seasonality and Volatility. Our results of operations for any interim period are not necessarily indicative of those for the
entire year because the air transportation business is subject to significant seasonal fluctuations. We generally expect demand to
be greater in the second and third quarters compared to the rest of the year. The air transportation business is also volatile and
highly affected by economic cycles and trends. Consumer confidence and discretionary spending, fear of terrorism or war,
weakening economic conditions, fare initiatives, fluctuations in fuel prices, labor actions, changes in governmental regulations
on taxes and fees, weather and other factors have resulted in significant fluctuations in revenues and results of operations in the
past. We believe demand for business travel historically has been more sensitive to economic pressures than demand for low-
price travel. Finally, a significant portion of our operations are concentrated in markets such as South Florida, the Caribbean,
Latin America and the Northeast and northern Midwest regions of the United States, which are particularly vulnerable to
weather, airport traffic constraints and other delays.
Aircraft Fuel. Fuel costs represent the single largest operating expense for most airlines, including ours. Fuel costs have
been subject to wide price fluctuations in recent years. Fuel availability and pricing are also subject to refining capacity, periods
of market surplus and shortage and demand for heating oil, gasoline and other petroleum products, as well as meteorological,
economic and political factors and events occurring throughout the world, which we can neither control nor accurately predict.
We source a significant portion of our fuel from refining resources located in the southeast United States, particularly facilities