Spirit Airlines 2015 Annual Report Download - page 54
Download and view the complete annual report
Please find page 54 of the 2015 Spirit Airlines annual report below. You can navigate through the pages in the report by either clicking on the pages listed below, or by using the keyword search tool below to find specific information within the annual report.-
 1
1 -
2
-
3
-
4
-
5
-
6
-
7
-
8
-
9
-
10
-
11
-
12
-
13
-
14
-
15
-
16
-
17
-
18
-
19
-
20
-
21
-
22
-
23
-
24
-
25
-
26
-
27
-
28
-
29
-
30
-
31
-
32
-
33
-
34
-
35
-
36
-
37
-
38
-
39
-
40
-
41
-
42
-
43
-
 44
44 -
 45
45 -
 46
46 -
 47
47 -
 48
48 -
 49
49 -
 50
50 -
 51
51 -
 52
52 -
 53
53 -
 54
54 -
 55
55 -
 56
56 -
 57
57 -
 58
58 -
 59
59 -
 60
60 -
 61
61 -
 62
62 -
 63
63 -
 64
64 -
65
-
66
-
67
-
68
-
69
-
70
-
71
-
72
-
73
-
74
-
75
-
76
-
77
-
78
-
79
-
80
-
81
-
82
-
83
-
84
-
85
-
86
-
87
-
88
-
89
-
90
-
91
-
92
-
93
-
94
-
95
-
96
-
97
-
98
-
99
-
100
-
101
-
102
-
103
-
104
-
105
 |
 |
54
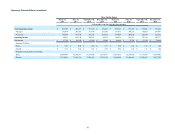
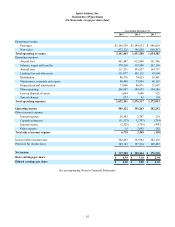
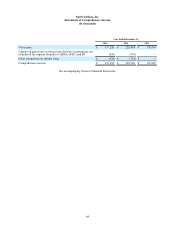
Quarterly Financial Data (unaudited)
Three Months Ended
March 31,
2014 June 30,
2014 September 30,
2014 December 31,
2014 March 31,
2015 June 30,
2015 September 30,
2015 December 31,
2015
(in thousands, except share and per share amounts)
Total operating revenue $ 437,987 $ 499,337 $ 519,769 $ 474,487 $ 493,355 $ 553,421 $ 574,841 $ 519,846
Passenger . . . . . . . . . . . . . . . . . . . . . . . . . . . . . . . . . . . . 253,878 302,487 317,038 271,569 273,466 308,573 319,812 267,487
Non-ticket . . . . . . . . . . . . . . . . . . . . . . . . . . . . . . . . . . . 184,109 196,850 202,731 202,918 219,889 244,848 255,029 252,359
Operating income . . . . . . . . . . . . . . . . . . . . . . . . . . . . . . 59,953 105,144 100,191 89,975 109,251 122,315 157,219 120,337
Net income . . . . . . . . . . . . . . . . . . . . . . . . . . . . . . . . . . . . $ 37,706 $ 64,849 $ 67,000 $ 55,909 $ 69,002 $ 76,704 $ 97,114 $ 74,400
Earnings Per Share:
Basic. . . . . . . . . . . . . . . . . . . . . . . . . . . . . . . . . . . . . . . . $ 0.52 $ 0.89 $ 0.92 $ 0.77 $ 0.94 $ 1.06 $ 1.35 $ 1.04
Diluted . . . . . . . . . . . . . . . . . . . . . . . . . . . . . . . . . . . . . . $ 0.51 $ 0.88 $ 0.91 $ 0.76 $ 0.94 $ 1.05 $ 1.35 $ 1.04
Weighted average shares outstanding:
Basic. . . . . . . . . . . . . . . . . . . . . . . . . . . . . . . . . . . . . . . . 72,684,495 72,739,861 72,754,697 72,775,619 73,053,535 72,518,019 71,737,697 71,543,409
Diluted . . . . . . . . . . . . . . . . . . . . . . . . . . . . . . . . . . . . . . 73,254,445 73,293,761 73,302,563 73,323,536 73,369,684 72,800,861 71,883,697 71,671,758