Spirit Airlines 2015 Annual Report Download - page 37
Download and view the complete annual report
Please find page 37 of the 2015 Spirit Airlines annual report below. You can navigate through the pages in the report by either clicking on the pages listed below, or by using the keyword search tool below to find specific information within the annual report.-
 1
1 -
2
-
3
-
4
-
5
-
6
-
7
-
8
-
9
-
10
-
11
-
12
-
13
-
14
-
15
-
16
-
17
-
18
-
19
-
20
-
21
-
22
-
23
-
24
-
25
-
26
-
 27
27 -
 28
28 -
 29
29 -
 30
30 -
 31
31 -
 32
32 -
 33
33 -
 34
34 -
 35
35 -
 36
36 -
 37
37 -
 38
38 -
 39
39 -
 40
40 -
 41
41 -
 42
42 -
 43
43 -
 44
44 -
 45
45 -
 46
46 -
 47
47 -
48
-
49
-
50
-
51
-
52
-
53
-
54
-
55
-
56
-
57
-
58
-
59
-
60
-
61
-
62
-
63
-
64
-
65
-
66
-
67
-
68
-
69
-
70
-
71
-
72
-
73
-
74
-
75
-
76
-
77
-
78
-
79
-
80
-
81
-
82
-
83
-
84
-
85
-
86
-
87
-
88
-
89
-
90
-
91
-
92
-
93
-
94
-
95
-
96
-
97
-
98
-
99
-
100
-
101
-
102
-
103
-
104
-
105
 |
 |

37
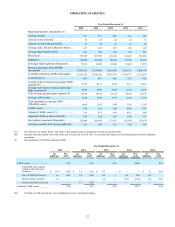
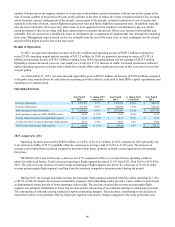
OPERATING STATISTICS
Year Ended December 31,
2015 2014 2013 2012 2011
Operating Statistics (unaudited) (A)
Average aircraft . . . . . . . . . . . . . . . . . . . . . . 72.7 57.7 49.9 41.2 34.8
Aircraft at end of period. . . . . . . . . . . . . . . . 79 65 54 45 37
Airports served in the period (B) . . . . . . . . . 57 56 56 55 50
Average daily Aircraft utilization (hours) . . 12.7 12.7 12.7 12.8 12.7
Average stage length (miles) . . . . . . . . . . . . 987 980 958 909 921
Block hours . . . . . . . . . . . . . . . . . . . . . . . . . 337,956 267,305 231,148 192,403 161,898
Departures . . . . . . . . . . . . . . . . . . . . . . . . . . 128,902 102,594 90,284 78,582 65,565
Passenger flight segments (thousands). . . . . 17,921 14,294 12,414 10,423 8,518
Revenue passenger miles (RPMs)
(thousands). . . . . . . . . . . . . . . . . . . . . . . . . . 17,995,311 14,159,860 12,001,088 9,663,721 8,006,748
Available seat miles (ASMs) (thousands) . . 21,246,156 16,340,142 13,861,393 11,344,731 9,352,553
Load factor (%) . . . . . . . . . . . . . . . . . . . . . . 84.7 86.7 86.6 85.2 85.6
Average ticket revenue per passenger flight
segment ($). . . . . . . . . . . . . . . . . . . . . . . . . . 65.25 80.11 79.43 75.11 80.97
Average non-ticket revenue per passenger
flight segment ($). . . . . . . . . . . . . . . . . . . . . 54.24 55.03 53.84 51.39 44.79
Total revenue per passenger segment ($). . . 119.49 135.14 133.27 126.50 125.76
Average yield (cents) . . . . . . . . . . . . . . . . . . 11.90 13.64 13.79 13.64 13.38
Total operating revenue per ASM
(TRASM) (cents) . . . . . . . . . . . . . . . . . . . . . 10.08 11.82 11.94 11.62 11.45
CASM (cents). . . . . . . . . . . . . . . . . . . . . . . . 7.68 9.65 9.90 10.09 9.91
Adjusted CASM (cents) (C). . . . . . . . . . . . . 7.69 9.55 9.89 10.15 9.84
Adjusted CASM ex fuel (cents) (D). . . . . . . 5.50 5.88 5.91 6.00 5.72
Fuel gallons consumed (thousands) . . . . . . . 255,008 200,498 171,931 142,991 121,030
Average economic fuel cost per gallon ($) . 1.82 2.99 3.21 3.30 3.18
(A) See “Glossary of Airline Terms” elsewhere in this annual report for definitions of terms used in this table.
(B) Includes seasonal airports not served at the end of the period. Prior to 2013, we reported only airports served during the period with continuing
operations.
(C) Reconciliation of CASM to Adjusted CASM:
Year Ended December 31,
2015 2014 2013 2012 2011
(in
millions) Per
ASM (in
millions) Per
ASM (in
millions) Per
ASM (in
millions) Per
ASM (in
millions) Per
ASM
CASM (cents) ............................... 7.68 9.65 9.90 10.09 9.91
Unrealized losses (gains)
related to fuel derivative
contracts............................... $ (3.9) (0.02) $ 3.9 0.02 $ 0.3 — $ — — $ 3.2 0.03
Loss on disposal of assets .... 1.6 0.01 3.0 0.02 0.5 — 1.0 0.01 0.3
Special charges (credits) 0.7 — — — 0.2 — (8.5) (0.07) 3.2 0.03
Out of period fuel excise tax — — 9.3 0.06 — — — — —
Adjusted CASM (cents)................ 7.69 9.55 9.89 10.15 9.84
(D) Excludes aircraft fuel expense, loss on disposal of assets, and special charges.