Sears 2012 Annual Report Download - page 77
Download and view the complete annual report
Please find page 77 of the 2012 Sears annual report below. You can navigate through the pages in the report by either clicking on the pages listed below, or by using the keyword search tool below to find specific information within the annual report.-
 1
1 -
2
-
3
-
4
-
5
-
6
-
7
-
8
-
9
-
10
-
11
-
12
-
13
-
14
-
15
-
16
-
17
-
18
-
19
-
20
-
21
-
22
-
23
-
24
-
25
-
26
-
27
-
28
-
29
-
30
-
31
-
32
-
33
-
34
-
35
-
36
-
37
-
38
-
39
-
40
-
41
-
42
-
43
-
44
-
45
-
46
-
47
-
48
-
49
-
50
-
51
-
52
-
53
-
54
-
55
-
56
-
57
-
58
-
59
-
60
-
61
-
62
-
63
-
64
-
65
-
66
-
 67
67 -
 68
68 -
 69
69 -
 70
70 -
 71
71 -
 72
72 -
 73
73 -
 74
74 -
 75
75 -
 76
76 -
 77
77 -
 78
78 -
 79
79 -
 80
80 -
 81
81 -
 82
82 -
 83
83 -
 84
84 -
 85
85 -
 86
86 -
 87
87 -
88
-
89
-
90
-
91
-
92
-
93
-
94
-
95
-
96
-
97
-
98
-
99
-
100
-
101
-
102
-
103
-
104
-
105
-
106
-
107
-
108
-
109
-
110
-
111
-
112
-
113
-
114
-
115
-
116
-
117
-
118
-
119
-
120
-
121
-
122
-
123
-
124
-
125
-
126
-
127
-
128
-
129
 |
 |

SEARS HOLDINGS CORPORATION
Notes to Consolidated Financial Statements—(Continued)
77
are not active and inputs other than quoted market prices that are observable for the asset or liability, such as
interest rate curves and yield curves observable at commonly quoted intervals, volatilities, credit risk and
default rates.
Level 3 inputs – unobservable inputs for the asset or liability.
Accounts receivable, merchandise payables, short-term borrowings, accrued liabilities and domestic cash and
cash equivalents are reflected in the Consolidated Balance Sheets at cost, which approximates fair value due to the
short-term nature of these instruments. The fair value of our debt is disclosed in Note 3 to the Consolidated
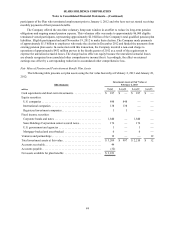
Financial Statements. The following tables provide the fair value measurement amounts for other financial assets
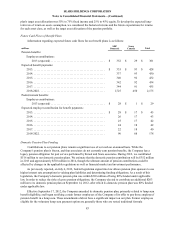
and liabilities recorded in our Consolidated Balance Sheets at fair value at February 2, 2013 and January 28, 2012:
Total Fair Value
Amounts at
millions February 2, 2013 Level 1 Level 2 Level 3
Cash equivalents(1) . . . . . . . . . . . . . . . . . . . . $ 181 $ 181 $ — $ —
Restricted cash(2). . . . . . . . . . . . . . . . . . . . . . 9 9 — —
Total. . . . . . . . . . . . . . . . . . . . . . . . . . . . $ 190 $ 190 $ — $ —
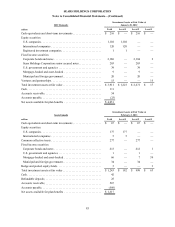
Total Fair Value
Amounts at
millions January 28, 2012 Level 1 Level 2 Level 3
Cash equivalents(1) . . . . . . . . . . . . . . . . . . . . $ 341 $ 341 $ — $ —
Restricted cash(2). . . . . . . . . . . . . . . . . . . . . . 7 7 — —
Foreign currency derivative assets(3) . . . . . . 1 — 1 —
Foreign currency derivative liabilities(4). . . . (6) — (6) —
Total. . . . . . . . . . . . . . . . . . . . . . . . . . . . $ 343 $ 348 $ (5) $ —
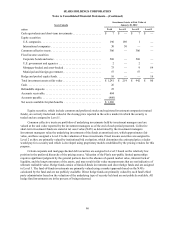
__________________
(1) Included within Cash and cash equivalents on the Consolidated Balance Sheets.
(2) Included within Restricted cash on the Consolidated Balance Sheets.
(3) Included within Prepaid expenses and other current assets on the Consolidated Balance Sheets.
(4) Included within Accrued expenses and other current liabilities on the Consolidated Balance Sheets.
The fair values of derivative assets and liabilities traded in the over-the-counter market are determined using
quantitative models that require the use of multiple inputs including interest rates, prices and indices to generate
pricing and volatility factors. The predominance of market inputs are actively quoted and can be validated through
external sources, including brokers, market transactions and third-party pricing services. Our derivative instruments
are valued using Level 2 measurements.
Assets and Liabilities that are Measured at Fair Value on a Nonrecurring Basis
Assets and liabilities that are measured at fair value on a nonrecurring basis relate primarily to our tangible
fixed assets, goodwill and other intangible assets, which are remeasured when the derived fair value is below
carrying value on our Consolidated Balance Sheets. For these assets, we do not periodically adjust carrying value to
fair value except in the event of impairment. When we determine that impairment has occurred, we measure the
impairment and adjust the carrying value as discussed in Note 1. With the exception of the goodwill and fixed asset
impairments described in Note 12 and Note 13, respectively, we had no significant remeasurements of such assets or
liabilities to fair value during 2012 and 2011.
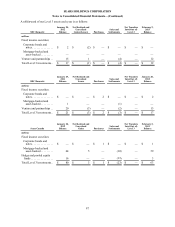
All of the fair value remeasurements were based on significant unobservable inputs (Level 3). Fixed asset fair
values were derived based on discussions with real estate brokers, review of comparable properties, if available, and
internal expertise related to the current marketplace conditions. Inputs for the goodwill included discounted cash
flow analyses, comparable marketplace fair value data, as well as management's assumptions in valuing significant
tangible and intangible assets, as described in Note 1, Summary of Significant Accounting Policies.