Sears 2012 Annual Report Download - page 28
Download and view the complete annual report
Please find page 28 of the 2012 Sears annual report below. You can navigate through the pages in the report by either clicking on the pages listed below, or by using the keyword search tool below to find specific information within the annual report.-
 1
1 -
2
-
3
-
4
-
5
-
6
-
7
-
8
-
9
-
10
-
11
-
12
-
13
-
14
-
15
-
16
-
17
-
 18
18 -
 19
19 -
 20
20 -
 21
21 -
 22
22 -
 23
23 -
 24
24 -
 25
25 -
 26
26 -
 27
27 -
 28
28 -
 29
29 -
 30
30 -
 31
31 -
 32
32 -
 33
33 -
 34
34 -
 35
35 -
 36
36 -
 37
37 -
 38
38 -
39
-
40
-
41
-
42
-
43
-
44
-
45
-
46
-
47
-
48
-
49
-
50
-
51
-
52
-
53
-
54
-
55
-
56
-
57
-
58
-
59
-
60
-
61
-
62
-
63
-
64
-
65
-
66
-
67
-
68
-
69
-
70
-
71
-
72
-
73
-
74
-
75
-
76
-
77
-
78
-
79
-
80
-
81
-
82
-
83
-
84
-
85
-
86
-
87
-
88
-
89
-
90
-
91
-
92
-
93
-
94
-
95
-
96
-
97
-
98
-
99
-
100
-
101
-
102
-
103
-
104
-
105
-
106
-
107
-
108
-
109
-
110
-
111
-
112
-
113
-
114
-
115
-
116
-
117
-
118
-
119
-
120
-
121
-
122
-
123
-
124
-
125
-
126
-
127
-
128
-
129
 |
 |

28
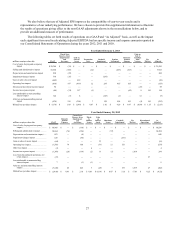
Year Ended January 29, 2011
millions, except per share data GAAP
Domestic
Pension
Expense
Closed Store
Reserve and
Severance
Mark-
to-
Market
Losses
Gain on
Sales
of Real
Estate
Canadian
Dividend
Tax
Impact Tax
Matters Discontinued
Operations As
Adjusted
Cost of sales, buying and occupancy impact . . . . . . . . . $31,000 $ — $ (12) $ — $ — $ — $ — $ — $ 30,988
Selling and administrative impact . . . . . . . . . . . . . . . . . 10,425 (120) (14) — — — — — 10,291
Depreciation and amortization impact. . . . . . . . . . . . . . 869 — (10) — — — — — 859
Gain on sales of assets impact . . . . . . . . . . . . . . . . . . . . (67) — — — 35 — — — (32)
Operating income impact. . . . . . . . . . . . . . . . . . . . . . . . 437 120 36 — (35) — — — 558
Other loss impact . . . . . . . . . . . . . . . . . . . . . . . . . . . . . . (14) — — 6 — — — — (8)
Income tax expense impact . . . . . . . . . . . . . . . . . . . . . . (27) (24) (6)(1) 7 9 (13) — (55)
Income from discontinued operations, net of tax,
impact. . . . . . . . . . . . . . . . . . . . . . . . . . . . . . . . . . . 11 — — — — — — (11) —
Income attributable to noncontrolling interest impact. . (17) — — (1) — — — — (18)
After tax and noncontrolling interest impact . . . . . . . . . 133 96 30 4 (28) 9 (13)(11) 220
Diluted income per share impact . . . . . . . . . . . . . . . . . . $ 1.19 $ 0.86 $ 0.27 $ 0.04 $ (0.25) $ 0.08 $ (0.12) $ (0.10) $ 1.97
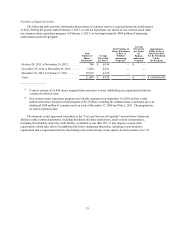
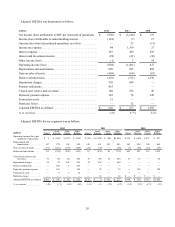
During 2012, we recorded a $455 million non-cash charge related to pension settlements as a result of the
requirement to expense the unrealized actuarial losses. The charge had no effect on equity because the unrealized
actuarial losses were already recognized in accumulated other comprehensive income/(loss). Accordingly, the effect
on retained earnings was offset by a corresponding reduction in accumulated other comprehensive loss.
During 2011, we recorded a $1.8 billion non-cash charge to establish a valuation allowance against our
domestic deferred tax assets. Accounting rules generally require that a valuation reserve be established when income
has not been generated over a three-year cumulative period to support the deferred tax asset. While an accounting
loss was recorded, we believe no economic loss has occurred as these net operating losses and tax benefits remain
available to reduce future taxes as income is generated in subsequent periods.
Contributions to our pension plans remain a significant use of our cash on an annual basis. While the
Company's pension plan is frozen, and thus associates do not currently earn pension benefits, we have a legacy
pension obligation for past service performed by Kmart and Sears associates. The annual pension expense included
in our financial statements related to these legacy domestic pension plans was relatively minimal in years prior to
2009. However, due to the severe decline in the capital markets that occurred in the latter part of 2008, our domestic
pension expense was $165 million in 2012, $74 million in 2011 and $120 million in 2010.
During 2010, Sears Canada paid $754 million in dividends of which Holdings received $639 million. As Sears
Canada is a consolidated subsidiary of Holdings, no income was recognized on the receipt of the dividend. However,
Holdings did record $9 million of income tax expense related to the dividend.
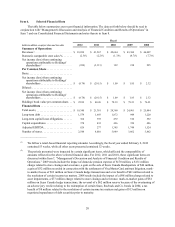
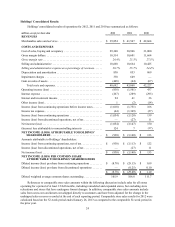
Revenues and Comparable Store Sales
Revenues decreased $1.7 billion, or 4.1%, to $39.9 billion, as compared to revenues of $41.6 billion in 2011.
The decline in revenue was primarily the result of having fewer Kmart and Sears Full-line stores in operation, a
decrease in domestic comparable store sales of 2.5% and the separation of the Sears Hometown and Outlet
businesses, partially offset by the inclusion of an additional week of revenues in 2012. The Company recorded
approximately $500 million of revenues during the 53rd week of 2012. The separation of the Sears Hometown and
Outlet businesses resulted in a net decrease in revenues of approximately $100 million. Additionally, Sears Canada
had a 5.6% decline in comparable stores sales and revenues for the year included a decrease of $37 million due to
changes in foreign currency exchange rates.
Domestic comparable store sales declined 2.5% with declines of 1.4% at Sears Domestic and 3.7% at Kmart.
Excluding the consumer electronics category, total domestic comparable store sales decreased 1.4% with Sears
Domestic decreasing only 0.1% and Kmart decreasing 2.8%.
The decline in comparable store sales of 1.4% at Sears Domestic was driven by decreases in consumer
electronics, lawn and garden and home appliances as well as at Sears Auto Centers. These decreases were partially
offset by increases in apparel and home. The Kmart decline in comparable store sales of 3.7% reflects decreases in a