Sears 2012 Annual Report Download - page 43
Download and view the complete annual report
Please find page 43 of the 2012 Sears annual report below. You can navigate through the pages in the report by either clicking on the pages listed below, or by using the keyword search tool below to find specific information within the annual report.-
 1
1 -
2
-
3
-
4
-
5
-
6
-
7
-
8
-
9
-
10
-
11
-
12
-
13
-
14
-
15
-
16
-
17
-
18
-
19
-
20
-
21
-
22
-
23
-
24
-
25
-
26
-
27
-
28
-
29
-
30
-
31
-
32
-
 33
33 -
 34
34 -
 35
35 -
 36
36 -
 37
37 -
 38
38 -
 39
39 -
 40
40 -
 41
41 -
 42
42 -
 43
43 -
 44
44 -
 45
45 -
 46
46 -
 47
47 -
 48
48 -
 49
49 -
 50
50 -
 51
51 -
 52
52 -
 53
53 -
54
-
55
-
56
-
57
-
58
-
59
-
60
-
61
-
62
-
63
-
64
-
65
-
66
-
67
-
68
-
69
-
70
-
71
-
72
-
73
-
74
-
75
-
76
-
77
-
78
-
79
-
80
-
81
-
82
-
83
-
84
-
85
-
86
-
87
-
88
-
89
-
90
-
91
-
92
-
93
-
94
-
95
-
96
-
97
-
98
-
99
-
100
-
101
-
102
-
103
-
104
-
105
-
106
-
107
-
108
-
109
-
110
-
111
-
112
-
113
-
114
-
115
-
116
-
117
-
118
-
119
-
120
-
121
-
122
-
123
-
124
-
125
-
126
-
127
-
128
-
129
 |
 |

43
market leading proprietary brands such as Kenmore, Craftsman and DieHard, and well-established stand-alone
businesses such as Lands’ End and Sears Canada. This asset base provides us flexibility as we continue to transform
our business.
We took several actions in 2012 to enhance our financial flexibility, generate liquidity and financially de-risk
our Company. By transforming our Company to a more nimble, less asset-intensive business model, we are reducing
the level of risk in our operational structure and balance sheet while concurrently improving the returns on our
invested capital. The focus of this model is to win in the new retail marketplace by leveraging our stores, brands,
online channels, social media assets and membership programs as an integrated retailer.
In summary, our actions positively impacted our liquidity by $1.8 billion, even after consideration of the $203
million domestic pension contribution we chose to make in September 2012, while unlocking the value in our asset
portfolio. These actions have included:
• the separation of our Sears Hometown and Outlet businesses through a rights offering transaction, which
generated gross proceeds of approximately $447 million;
• the partial spin-off of 45% of Sears Canada;
• the execution of various real estate transactions which generated cash proceeds of approximately $440
million;
• Reducing inventory by nearly $1.0 billion below last year's level and adjusting our promotional cadence to
be more targeted;
• Reducing our fixed cost structure by over $500 million; and
• Capitalizing on an opportunity to reduce risk related to our legacy pension obligation by making a
voluntary offer to former employees to pay a lump sum.
We expect to generate at least $500 million in additional liquidity through monetization of assets over the next
12 months through selective actions that are consistent with our focus on creating long-term value. The exact form
and amount will depend on specific circumstances and opportunities, including market conditions. In addition to our
asset monetizations, we currently expect to reduce 2013 peak domestic inventory by $500 million from the 2012
level of $8.6 billion at the end of the third quarter as a result of stores already or expected to be closed, initiatives
underway to reduce slow-moving inventory and modest productivity improvement. This action is expected to
generate $300 million of cash after consideration of related payables. We also expect to further reduce our fixed cost
base by another $200 million in 2013.
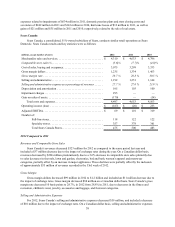
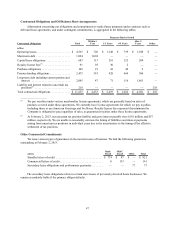
Our outstanding borrowings at February 2, 2013 and January 28, 2012 were as follows:
millions February 2,
2013 January 28,
2012
Short-term borrowings:
Unsecured commercial paper. . . . . . . . . . . . . . . . . . . . . . . . . . . . . . . . . . . . . $ 345 $ 337
Secured borrowings . . . . . . . . . . . . . . . . . . . . . . . . . . . . . . . . . . . . . . . . . . . . 749 838
Long-term debt, including current portion:
Notes and debentures outstanding . . . . . . . . . . . . . . . . . . . . . . . . . . . . . . . . . 1,593 1,863
Capitalized lease obligations . . . . . . . . . . . . . . . . . . . . . . . . . . . . . . . . . . . . . 433 455
Total borrowings . . . . . . . . . . . . . . . . . . . . . . . . . . . . . . . . . . . . . . . . . . . . . . . . . . $ 3,120 $ 3,493
Domestic Credit Agreement
During the first quarter of 2011, we entered into a $3.275 billion credit agreement (the “Domestic Credit
Agreement”) which expires in April 2016. We view this credit facility as our most cost efficient funding mechanism
and therefore use it as a primary source of funding.
Advances under the Domestic Credit Agreement bear interest at a rate equal to, at the election of the
Borrowers, either the London Interbank Offered Rate (“LIBOR”) or a base rate, in either case plus an applicable
margin. The Domestic Credit Agreement’s interest rates for LIBOR-based borrowings vary based on leverage in the
range of LIBOR plus 2.0% to 2.5%. Interest rates for base rate-based borrowings vary based on leverage in the