Sears 2012 Annual Report Download - page 56
Download and view the complete annual report
Please find page 56 of the 2012 Sears annual report below. You can navigate through the pages in the report by either clicking on the pages listed below, or by using the keyword search tool below to find specific information within the annual report.-
 1
1 -
2
-
3
-
4
-
5
-
6
-
7
-
8
-
9
-
10
-
11
-
12
-
13
-
14
-
15
-
16
-
17
-
18
-
19
-
20
-
21
-
22
-
23
-
24
-
25
-
26
-
27
-
28
-
29
-
30
-
31
-
32
-
33
-
34
-
35
-
36
-
37
-
38
-
39
-
40
-
41
-
42
-
43
-
44
-
45
-
 46
46 -
 47
47 -
 48
48 -
 49
49 -
 50
50 -
 51
51 -
 52
52 -
 53
53 -
 54
54 -
 55
55 -
 56
56 -
 57
57 -
 58
58 -
 59
59 -
 60
60 -
 61
61 -
 62
62 -
 63
63 -
 64
64 -
 65
65 -
 66
66 -
67
-
68
-
69
-
70
-
71
-
72
-
73
-
74
-
75
-
76
-
77
-
78
-
79
-
80
-
81
-
82
-
83
-
84
-
85
-
86
-
87
-
88
-
89
-
90
-
91
-
92
-
93
-
94
-
95
-
96
-
97
-
98
-
99
-
100
-
101
-
102
-
103
-
104
-
105
-
106
-
107
-
108
-
109
-
110
-
111
-
112
-
113
-
114
-
115
-
116
-
117
-
118
-
119
-
120
-
121
-
122
-
123
-
124
-
125
-
126
-
127
-
128
-
129
 |
 |

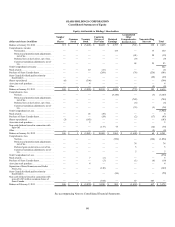
56
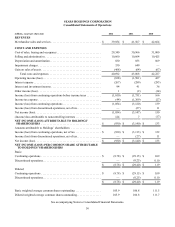
SEARS HOLDINGS CORPORATION
Consolidated Statements of Operations
millions, except per share data 2012 2011 2010
REVENUES
Merchandise sales and services . . . . . . . . . . . . . . . . . . . . . . . . . . . . . . . . . . . $ 39,854 $ 41,567 $ 42,664
COSTS AND EXPENSES
Cost of sales, buying and occupancy. . . . . . . . . . . . . . . . . . . . . . . . . . . . . . . 29,340 30,966 31,000
Selling and administrative . . . . . . . . . . . . . . . . . . . . . . . . . . . . . . . . . . . . . . . 10,660 10,664 10,425
Depreciation and amortization. . . . . . . . . . . . . . . . . . . . . . . . . . . . . . . . . . . . 830 853 869
Impairment charges . . . . . . . . . . . . . . . . . . . . . . . . . . . . . . . . . . . . . . . . . . . . 330 649 —
Gain on sales of assets . . . . . . . . . . . . . . . . . . . . . . . . . . . . . . . . . . . . . . . . . . (468)(64)(67)
Total costs and expenses. . . . . . . . . . . . . . . . . . . . . . . . . . . . . . . . . . . . . 40,692 43,068 42,227
Operating income (loss). . . . . . . . . . . . . . . . . . . . . . . . . . . . . . . . . . . . . . . . . (838)(1,501) 437
Interest expense . . . . . . . . . . . . . . . . . . . . . . . . . . . . . . . . . . . . . . . . . . . . . . . (267)(289)(293)
Interest and investment income . . . . . . . . . . . . . . . . . . . . . . . . . . . . . . . . . . . 94 41 36
Other income (loss) . . . . . . . . . . . . . . . . . . . . . . . . . . . . . . . . . . . . . . . . . . . . 1(2)(14)
Income (loss) from continuing operations before income taxes . . . . . . . . . . (1,010)(1,751) 166
Income tax expense . . . . . . . . . . . . . . . . . . . . . . . . . . . . . . . . . . . . . . . . . . . . (44)(1,369)(27)
Income (loss) from continuing operations. . . . . . . . . . . . . . . . . . . . . . . . . . . (1,054)(3,120) 139
Income (loss) from discontinued operations, net of tax. . . . . . . . . . . . . . . . . —(27) 11
Net income (loss). . . . . . . . . . . . . . . . . . . . . . . . . . . . . . . . . . . . . . . . . . . . . . (1,054)(3,147) 150
(Income) loss attributable to noncontrolling interests . . . . . . . . . . . . . . . . . . 124 7 (17)
NET INCOME (LOSS) ATTRIBUTABLE TO HOLDINGS’
SHAREHOLDERS . . . . . . . . . . . . . . . . . . . . . . . . . . . . . . . . . . . . . . . . . . $(930) $ (3,140) $ 133
Amounts attributable to Holdings’ shareholders: . . . . . . . . . . . . . . . . . . . . .
Income (loss) from continuing operations, net of tax . . . . . . . . . . . . . . . . . . $(930) $ (3,113) $ 122
Income (loss) from discontinued operations, net of tax. . . . . . . . . . . . . . . . . —(27) 11
Net income (loss). . . . . . . . . . . . . . . . . . . . . . . . . . . . . . . . . . . . . . . . . . . . . . $(930) $ (3,140) $ 133
NET INCOME (LOSS) PER COMMON SHARE ATTRIBUTABLE
TO HOLDINGS’ SHAREHOLDERS
Basic:
Continuing operations . . . . . . . . . . . . . . . . . . . . . . . . . . . . . . . . . . . . . . . . . . $(8.78) $ (29.15) $ 1.09
Discontinued operations. . . . . . . . . . . . . . . . . . . . . . . . . . . . . . . . . . . . . . . . . —(0.25) 0.10
$(8.78) $ (29.40) $ 1.19
Diluted:
Continuing operations . . . . . . . . . . . . . . . . . . . . . . . . . . . . . . . . . . . . . . . . . . $(8.78) $ (29.15) $ 1.09
Discontinued operations. . . . . . . . . . . . . . . . . . . . . . . . . . . . . . . . . . . . . . . . . —(0.25) 0.10
$(8.78) $ (29.40) $ 1.19
Basic weighted average common shares outstanding . . . . . . . . . . . . . . . . . . 105.9 106.8 111.5
Diluted weighted average common shares outstanding. . . . . . . . . . . . . . . . . 105.9 106.8 111.7
See accompanying Notes to Consolidated Financial Statements.