Sears 2012 Annual Report Download - page 38
Download and view the complete annual report
Please find page 38 of the 2012 Sears annual report below. You can navigate through the pages in the report by either clicking on the pages listed below, or by using the keyword search tool below to find specific information within the annual report.-
 1
1 -
2
-
3
-
4
-
5
-
6
-
7
-
8
-
9
-
10
-
11
-
12
-
13
-
14
-
15
-
16
-
17
-
18
-
19
-
20
-
21
-
22
-
23
-
24
-
25
-
26
-
27
-
 28
28 -
 29
29 -
 30
30 -
 31
31 -
 32
32 -
 33
33 -
 34
34 -
 35
35 -
 36
36 -
 37
37 -
 38
38 -
 39
39 -
 40
40 -
 41
41 -
 42
42 -
 43
43 -
 44
44 -
 45
45 -
 46
46 -
 47
47 -
 48
48 -
49
-
50
-
51
-
52
-
53
-
54
-
55
-
56
-
57
-
58
-
59
-
60
-
61
-
62
-
63
-
64
-
65
-
66
-
67
-
68
-
69
-
70
-
71
-
72
-
73
-
74
-
75
-
76
-
77
-
78
-
79
-
80
-
81
-
82
-
83
-
84
-
85
-
86
-
87
-
88
-
89
-
90
-
91
-
92
-
93
-
94
-
95
-
96
-
97
-
98
-
99
-
100
-
101
-
102
-
103
-
104
-
105
-
106
-
107
-
108
-
109
-
110
-
111
-
112
-
113
-
114
-
115
-
116
-
117
-
118
-
119
-
120
-
121
-
122
-
123
-
124
-
125
-
126
-
127
-
128
-
129
 |
 |

38
expenses related to impairments of $634 million in 2011, domestic pension plans and store closing costs and
severance of $242 million in 2011 and $143 million in 2010, hurricane losses of $12 million in 2011, as well as
gains of $21 million and $35 million in 2011 and 2010, respectively, related to the sale of real estate.
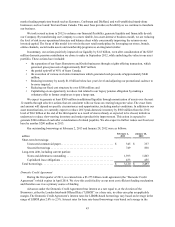
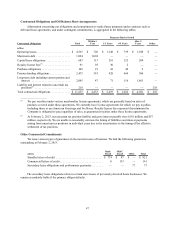
Sears Canada
Sears Canada, a consolidated, 51%-owned subsidiary of Sears, conducts similar retail operations as Sears
Domestic. Sears Canada results and key statistics were as follows:
millions, except number of stores 2012 2011 2010
Merchandise sales and services. . . . . . . . . . . . . . . . . . . . . . . . . . . . . . . . $ 4,310 $ 4,633 $ 4,796
Comparable store sales %. . . . . . . . . . . . . . . . . . . . . . . . . . . . . . . . . . . . (5.6)% (7.7)% (4.0)%
Cost of sales, buying and occupancy. . . . . . . . . . . . . . . . . . . . . . . . . . . . 3,075 3,299 3,333
Gross margin dollars . . . . . . . . . . . . . . . . . . . . . . . . . . . . . . . . . . . . . . . . 1,235 1,334 1,463
Gross margin rate . . . . . . . . . . . . . . . . . . . . . . . . . . . . . . . . . . . . . . . . . . 28.7 % 28.8 % 30.5 %
Selling and administrative. . . . . . . . . . . . . . . . . . . . . . . . . . . . . . . . . . . . 1,192 1,251 1,144
Selling and administrative expense as a percentage of revenues . . . . . . 27.7 % 27.0 % 23.9 %
Depreciation and amortization . . . . . . . . . . . . . . . . . . . . . . . . . . . . . . . . 105 103 100
Impairment charges . . . . . . . . . . . . . . . . . . . . . . . . . . . . . . . . . . . . . . . . . 295 — —
Gain on sales of assets. . . . . . . . . . . . . . . . . . . . . . . . . . . . . . . . . . . . . . . (170) — (14)
Total costs and expenses. . . . . . . . . . . . . . . . . . . . . . . . . . . . . . . . . . 4,497 4,653 4,563
Operating income (loss) . . . . . . . . . . . . . . . . . . . . . . . . . . . . . . . . . . . . . $ (187) $ (20) $ 233
Adjusted EBITDA. . . . . . . . . . . . . . . . . . . . . . . . . . . . . . . . . . . . . . . . . . $ 69 $ 101 $ 319
Number of:
Full-line stores. . . . . . . . . . . . . . . . . . . . . . . . . . . . . . . . . . . . . . 118 122 122
Specialty stores . . . . . . . . . . . . . . . . . . . . . . . . . . . . . . . . . . . . . 357 378 361
Total Sears Canada Stores. . . . . . . . . . . . . . . . . . . . . . . . . . . . . 475 500 483
2012 Compared to 2011
Revenues and Comparable Store Sales
Sears Canada’s revenues decreased $323 million for 2012 as compared to the same period last year and
included a $37 million decrease due to the impact of exchange rates during the year. On a Canadian dollar basis,
revenues decreased by $286 million predominately due to a 5.6% decrease in comparable store sales primarily due
to sales decreases in the tools, lawn and garden, electronics, bed and bath, women's apparel and menswear
categories, partially offset by an increase in major appliances. These declines were partially offset by the inclusion
of approximately $35 million of revenues recorded in the 53rd week of 2012.
Gross Margin
Gross margin dollars decreased $99 million in 2012 to $1.2 billion and included an $11 million decrease due to
the impact of exchange rates. Gross margin decreased $88 million on a Canadian dollar basis. Sears Canada’s gross
margin rate decreased 10 basis points to 28.7%, in 2012 from 28.8% in 2011, due to decreases in the fitness and
recreation, children's wear, jewelry, accessories and luggage, and footwear categories.
Selling and Administrative Expenses
For 2012, Sears Canada’s selling and administrative expenses decreased $59 million, and included a decrease
of $10 million due to the impact of exchange rates. On a Canadian dollar basis, selling and administrative expenses