Sears 2012 Annual Report Download - page 34
Download and view the complete annual report
Please find page 34 of the 2012 Sears annual report below. You can navigate through the pages in the report by either clicking on the pages listed below, or by using the keyword search tool below to find specific information within the annual report.-
 1
1 -
2
-
3
-
4
-
5
-
6
-
7
-
8
-
9
-
10
-
11
-
12
-
13
-
14
-
15
-
16
-
17
-
18
-
19
-
20
-
21
-
22
-
23
-
 24
24 -
 25
25 -
 26
26 -
 27
27 -
 28
28 -
 29
29 -
 30
30 -
 31
31 -
 32
32 -
 33
33 -
 34
34 -
 35
35 -
 36
36 -
 37
37 -
 38
38 -
 39
39 -
 40
40 -
 41
41 -
 42
42 -
 43
43 -
 44
44 -
45
-
46
-
47
-
48
-
49
-
50
-
51
-
52
-
53
-
54
-
55
-
56
-
57
-
58
-
59
-
60
-
61
-
62
-
63
-
64
-
65
-
66
-
67
-
68
-
69
-
70
-
71
-
72
-
73
-
74
-
75
-
76
-
77
-
78
-
79
-
80
-
81
-
82
-
83
-
84
-
85
-
86
-
87
-
88
-
89
-
90
-
91
-
92
-
93
-
94
-
95
-
96
-
97
-
98
-
99
-
100
-
101
-
102
-
103
-
104
-
105
-
106
-
107
-
108
-
109
-
110
-
111
-
112
-
113
-
114
-
115
-
116
-
117
-
118
-
119
-
120
-
121
-
122
-
123
-
124
-
125
-
126
-
127
-
128
-
129
 |
 |
34
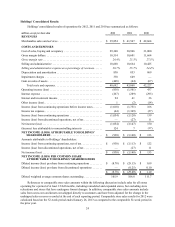
Operating Income (Loss)
Kmart recorded operating income of $5 million in 2012 as compared to an operating loss of $34 million in
2011. This improvement was primarily driven by the improvement in gross margin rate and a decrease in selling and
administrative expenses which more than offset the above noted decrease in revenues. Operating income in 2012
included expenses related to store closing and severance costs of $85 million and store impairments of $10 million
as well as a gain of $11 million related to the sale of one store. Kmart's operating loss for 2011 included expenses
related to store impairments of $15 million, store closing and severance costs of $76 million as well as a gain of $12
million related to the sale of one store.
2011 Compared to 2010
Revenues and Comparable Store Sales
Kmart's total sales decreased by $308 million, as comparable store sales decreased 1.4% in 2011. The declines
in revenue were primarily due to lower comparable store sales and the effect of having fewer Kmart stores in
operation. The Kmart declines in comparable store sales included decreases in the consumer electronics, pharmacy,
home, apparel and jewelry categories, partially offset by an increase in the grocery and household category.
Gross Margin
Kmart generated $3.5 billion in gross margin in 2011 and $3.8 billion in 2010. The decrease in gross margin
dollars of $369 million was mainly driven by a decline in the gross margin rate and included charges of $46 million
and $6 million for markdowns recorded in connection with store closings announced during 2011 and 2010,
respectively.
Kmart's gross margin rate was 22.7% in 2011 and 24.6% in 2010. The decline of 190 basis points was mainly
due to higher commodity costs and markdowns in apparel and home, as well as markdowns in consumer electronics.
Selling and Administrative Expenses
Kmart's selling and administrative expenses increased $30 million in 2011. The increase was mainly due to an
increase in store closing expenses. Selling and administrative expenses were impacted by store closing costs and
severance of $30 million and $7 million, in 2011 and 2010, respectively.
Kmart's selling and administrative expense rate was 22.1% in 2011 and 21.4% in 2010, and increased
primarily as a result of Kmart's decline in revenues.
Impairment Charges
We recorded impairment charges of $15 million during 2011 related to impairment of long-lived assets. We
did not record any such impairments in 2010. Impairment charges recorded during 2011 are further described in
Note 13 in Notes to Consolidated Financial Statements.
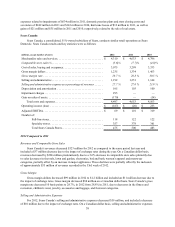
Gain on Sales of Assets
Kmart recorded a total net gain on sales of assets of $34 million in 2011 and $7 million in 2010. The gains on
sales of assets in 2011 included a gain of $12 million recognized on the sale of one store.
Operating Income (Loss)
Kmart recorded an operating loss of $34 million in 2011, as compared to operating income of $353 million in
2010. The decrease in Kmart's operating results was primarily the result of a decline in gross margin dollars, driven
by the declines in the gross margin rate and revenues, and an increase in selling and administrative expenses.
Kmart's operating loss for 2011 included expenses related to impairments of $15 million, store closing and
severance costs of $76 million as well as a gain of $12 million related to the sale of one store. Operating income in
2010 included store closing and severance costs of $13 million.