Sears 2012 Annual Report Download - page 20
Download and view the complete annual report
Please find page 20 of the 2012 Sears annual report below. You can navigate through the pages in the report by either clicking on the pages listed below, or by using the keyword search tool below to find specific information within the annual report.-
 1
1 -
2
-
3
-
4
-
5
-
6
-
7
-
8
-
9
-
 10
10 -
 11
11 -
 12
12 -
 13
13 -
 14
14 -
 15
15 -
 16
16 -
 17
17 -
 18
18 -
 19
19 -
 20
20 -
 21
21 -
 22
22 -
 23
23 -
 24
24 -
 25
25 -
 26
26 -
 27
27 -
 28
28 -
 29
29 -
 30
30 -
31
-
32
-
33
-
34
-
35
-
36
-
37
-
38
-
39
-
40
-
41
-
42
-
43
-
44
-
45
-
46
-
47
-
48
-
49
-
50
-
51
-
52
-
53
-
54
-
55
-
56
-
57
-
58
-
59
-
60
-
61
-
62
-
63
-
64
-
65
-
66
-
67
-
68
-
69
-
70
-
71
-
72
-
73
-
74
-
75
-
76
-
77
-
78
-
79
-
80
-
81
-
82
-
83
-
84
-
85
-
86
-
87
-
88
-
89
-
90
-
91
-
92
-
93
-
94
-
95
-
96
-
97
-
98
-
99
-
100
-
101
-
102
-
103
-
104
-
105
-
106
-
107
-
108
-
109
-
110
-
111
-
112
-
113
-
114
-
115
-
116
-
117
-
118
-
119
-
120
-
121
-
122
-
123
-
124
-
125
-
126
-
127
-
128
-
129
 |
 |

20
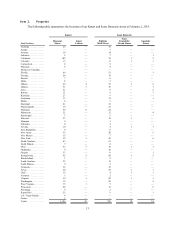
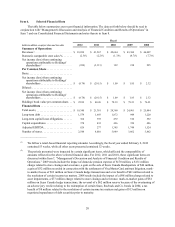
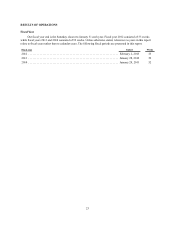
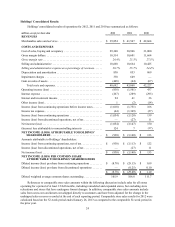
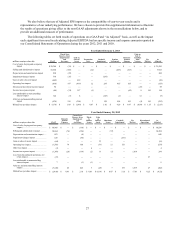
Item 6. Selected Financial Data
The table below summarizes our recent financial information. The data set forth below should be read in
conjunction with “Management's Discussion and Analysis of Financial Condition and Results of Operations” in
Item 7 and our Consolidated Financial Statements and notes thereto in Item 8.
Fiscal
dollars in millions, except per share and store data 2012 2011 2010 2009 2008
Summary of Operations
Revenues(1) . . . . . . . . . . . . . . . . . . . . . . . . . . . . . . . . . . . . . $ 39,854 $ 41,567 $ 42,664 $ 43,360 $ 46,007
Domestic comparable store sales % . . . . . . (2.5)% (2.2)% (1.3)% (4.7)% (7.7)%
Net income (loss) from continuing
operations attributable to Holdings'
shareholders(2) . . . . . . . . . . . . . . . . . . . . . . . . . . . . . . (930) (3,113) 122 218 295
Per Common Share . . . . . . . . . . . . . . . . . .
Basic:. . . . . . . . . . . . . . . . . . . . . . . . . . . . . .
Net income (loss) from continuing
operations attributable to Holdings'
shareholders . . . . . . . . . . . . . . . . . . . . . . $ (8.78) $ (29.15) $ 1.09 $ 1.85 $ 2.32
Diluted: . . . . . . . . . . . . . . . . . . . . . . . . . . . .
Net income (loss) from continuing
operations attributable to Holdings'
shareholders . . . . . . . . . . . . . . . . . . . . . . $ (8.78) $ (29.15) $ 1.09 $ 1.85 $ 2.32
Holdings' book value per common share. . . $ 25.89 $ 40.26 $ 78.19 $ 79.21 $ 76.91
Financial Data . . . . . . . . . . . . . . . . . . . . . .
Total assets. . . . . . . . . . . . . . . . . . . . . . . . . . $ 19,340 $ 21,381 $ 24,360 $ 24,901 $ 25,444
Long-term debt . . . . . . . . . . . . . . . . . . . . . . 1,579 1,693 1,872 949 1,220
Long-term capital lease obligations. . . . . . . 364 395 472 510 552
Capital expenditures . . . . . . . . . . . . . . . . . . 378 432 426 350 486
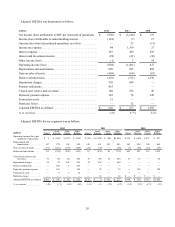
Adjusted EBITDA. . . . . . . . . . . . . . . . . . . . 626 277 1,385 1,744 1,524
Number of stores . . . . . . . . . . . . . . . . . . . . . 2,548 4,010 3,949 3,862 3,862
__________________
(1) We follow a retail-based financial reporting calendar. Accordingly, the fiscal year ended February 2, 2013
contained 53 weeks, while all other years presented contained 52 weeks.
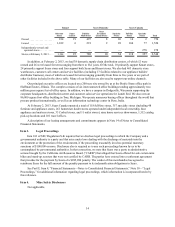
(2) The periods presented were impacted by certain significant items, which affected the comparability of
amounts reflected in the above selected financial data. For 2012, 2011 and 2010, these significant items are
discussed within Item 7, “Management's Discussion and Analysis of Financial Condition and Results of
Operations.” 2009 results include the impact of domestic pension expense of $170 million, a $131 million
charge related to store closings and severance, a gain on the sale of Sears Canada Headquarters of $44 million,
a gain of $32 million recorded in connection with the settlement of Visa/MasterCard antitrust litigation, mark-
to-market losses of $33 million on Sears Canada hedge transactions and a tax benefit of $41 million related to
the resolution of certain income tax matters. 2008 results include the impact of a $98 million charge related to
asset impairments, a $77 million charge related to store closings and severance, mark-to-market gains of $81
million on Sears Canada hedge transactions, the reversal of a $62 million reserve because of the overturning of
an adverse jury verdict relating to the redemption of certain Sears, Roebuck and Co. bonds in 2004, a tax
benefit of $8 million related to the resolution of certain income tax matters and gains of $13 million on
negotiated repurchases of debt securities prior to maturity.