Sears 2012 Annual Report Download - page 107
Download and view the complete annual report
Please find page 107 of the 2012 Sears annual report below. You can navigate through the pages in the report by either clicking on the pages listed below, or by using the keyword search tool below to find specific information within the annual report.-
 1
1 -
2
-
3
-
4
-
5
-
6
-
7
-
8
-
9
-
10
-
11
-
12
-
13
-
14
-
15
-
16
-
17
-
18
-
19
-
20
-
21
-
22
-
23
-
24
-
25
-
26
-
27
-
28
-
29
-
30
-
31
-
32
-
33
-
34
-
35
-
36
-
37
-
38
-
39
-
40
-
41
-
42
-
43
-
44
-
45
-
46
-
47
-
48
-
49
-
50
-
51
-
52
-
53
-
54
-
55
-
56
-
57
-
58
-
59
-
60
-
61
-
62
-
63
-
64
-
65
-
66
-
67
-
68
-
69
-
70
-
71
-
72
-
73
-
74
-
75
-
76
-
77
-
78
-
79
-
80
-
81
-
82
-
83
-
84
-
85
-
86
-
87
-
88
-
89
-
90
-
91
-
92
-
93
-
94
-
95
-
96
-
 97
97 -
 98
98 -
 99
99 -
 100
100 -
 101
101 -
 102
102 -
 103
103 -
 104
104 -
 105
105 -
 106
106 -
 107
107 -
 108
108 -
 109
109 -
 110
110 -
 111
111 -
 112
112 -
 113
113 -
 114
114 -
 115
115 -
 116
116 -
 117
117 -
118
-
119
-
120
-
121
-
122
-
123
-
124
-
125
-
126
-
127
-
128
-
129
 |
 |

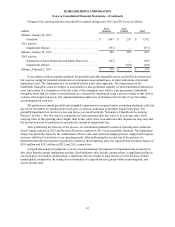
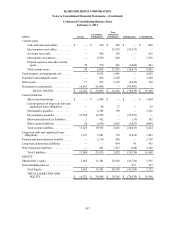
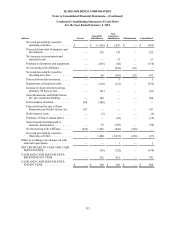
SEARS HOLDINGS CORPORATION
Notes to Consolidated Financial Statements—(Continued)
107
Condensed Consolidating Balance Sheet
February 2, 2013
millions Parent Guarantor
Subsidiaries
Non-
Guarantor
Subsidiaries Eliminations Consolidated
Current assets
Cash and cash equivalents . . . . . . . . . $ — $ 320 $ 289 $ — $ 609
Intercompany receivables. . . . . . . . . . — — 25,553 (25,553) —
Accounts receivable . . . . . . . . . . . . . . — 506 129 — 635
Merchandise inventories. . . . . . . . . . . — 6,709 849 — 7,558
Prepaid expenses and other current
assets . . . . . . . . . . . . . . . . . . . . . . . . 92 970 461 (1,060) 463
Total current assets . . . . . . . . . . . . . . . 92 8,505 27,281 (26,613) 9,265
Total property and equipment, net. . . . . . . — 4,412 1,641 — 6,053
Goodwill and intangible assets . . . . . . . . . — 968 2,292 — 3,260
Other assets . . . . . . . . . . . . . . . . . . . . . . . . 17 223 3,147 (2,625) 762
Investment in subsidiaries . . . . . . . . . . . . . 16,413 24,988 — (41,401) —
TOTAL ASSETS. . . . . . . . . . . . . $ 16,522 $ 39,096 $ 34,361 $ (70,639) $ 19,340
Current liabilities
Short-term borrowings . . . . . . . . . . . . $ — $ 1,094 $ — $ — $ 1,094
Current portion of long-term debt and
capitalized lease obligations . . . . . . — 66 17 — 83
Merchandise payables. . . . . . . . . . . . . — 2,392 369 — 2,761
Intercompany payables. . . . . . . . . . . . 12,594 12,959 — (25,553) —
Short-term deferred tax liabilities. . . . 3 412 — (33) 382
Other current liabilities. . . . . . . . . . . . 26 2,640 2,455 (1,027) 4,094
Total current liabilities . . . . . . . . . . . . 12,623 19,563 2,841 (26,613) 8,414
Long-term debt and capitalized lease
obligations . . . . . . . . . . . . . . . . . . . . . . . 1,237 3,081 135 (2,510) 1,943
Pension and postretirement benefits . . . . . — 2,310 420 — 2,730
Long-term deferred tax liabilities . . . . . . . — — 914 41 955
Other long-term liabilities . . . . . . . . . . . . . — 861 1,513 (248) 2,126
Total Liabilities. . . . . . . . . . . . . . . . . . 13,860 25,815 5,823 (29,330) 16,168
EQUITY
Shareholder’s equity . . . . . . . . . . . . . . . . . 2,662 13,281 28,538 (41,726) 2,755
Noncontrolling interest . . . . . . . . . . . . . . . — — — 417 417
Total Equity . . . . . . . . . . . . . . . . . . . . 2,662 13,281 28,538 (41,309) 3,172
TOTAL LIABILITIES AND
EQUITY . . . . . . . . . . . . . . . . . . . . . $ 16,522 $ 39,096 $ 34,361 $ (70,639) $ 19,340