Sears 2012 Annual Report Download - page 40
Download and view the complete annual report
Please find page 40 of the 2012 Sears annual report below. You can navigate through the pages in the report by either clicking on the pages listed below, or by using the keyword search tool below to find specific information within the annual report.-
 1
1 -
2
-
3
-
4
-
5
-
6
-
7
-
8
-
9
-
10
-
11
-
12
-
13
-
14
-
15
-
16
-
17
-
18
-
19
-
20
-
21
-
22
-
23
-
24
-
25
-
26
-
27
-
28
-
29
-
 30
30 -
 31
31 -
 32
32 -
 33
33 -
 34
34 -
 35
35 -
 36
36 -
 37
37 -
 38
38 -
 39
39 -
 40
40 -
 41
41 -
 42
42 -
 43
43 -
 44
44 -
 45
45 -
 46
46 -
 47
47 -
 48
48 -
 49
49 -
 50
50 -
51
-
52
-
53
-
54
-
55
-
56
-
57
-
58
-
59
-
60
-
61
-
62
-
63
-
64
-
65
-
66
-
67
-
68
-
69
-
70
-
71
-
72
-
73
-
74
-
75
-
76
-
77
-
78
-
79
-
80
-
81
-
82
-
83
-
84
-
85
-
86
-
87
-
88
-
89
-
90
-
91
-
92
-
93
-
94
-
95
-
96
-
97
-
98
-
99
-
100
-
101
-
102
-
103
-
104
-
105
-
106
-
107
-
108
-
109
-
110
-
111
-
112
-
113
-
114
-
115
-
116
-
117
-
118
-
119
-
120
-
121
-
122
-
123
-
124
-
125
-
126
-
127
-
128
-
129
 |
 |

40
Sears Canada's selling and administrative expense rate was 27.0% in 2011 and 23.9% in 2010, and increased
primarily due to the above noted increase in expenses and decrease in sales.
Operating Income (Loss)
Sears Canada recorded an operating loss of $20 million in 2011 and operating income of $233 million in 2010.
The $253 million decrease in operating results primarily reflects the above noted declines, on a Canadian dollar
basis, in sales and gross margin, and the increase in selling and administrative expenses.
ANALYSIS OF CONSOLIDATED FINANCIAL CONDITION
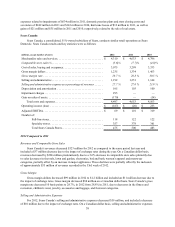
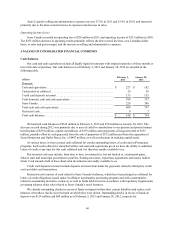
Cash Balances
Our cash and cash equivalents include all highly liquid investments with original maturities of three months or
less at the date of purchase. Our cash balances as of February 2, 2013 and January 28, 2012 are detailed in the
following table.
millions February 2,
2013 January 28,
2012
Domestic
Cash and equivalents. . . . . . . . . . . . . . . . . . . . . . . . . . . . . . . . . . . . . . . . . . . . . . . $ 227 $ 182
Cash posted as collateral . . . . . . . . . . . . . . . . . . . . . . . . . . . . . . . . . . . . . . . . . . . . 20 20
Credit card deposits in transit . . . . . . . . . . . . . . . . . . . . . . . . . . . . . . . . . . . . . . . . 133 155
Total domestic cash and cash equivalents. . . . . . . . . . . . . . . . . . . . . . . . . . . . . . . 380 357
Sears Canada . . . . . . . . . . . . . . . . . . . . . . . . . . . . . . . . . . . . . . . . . . . . . . . . . . . . . 229 390
Total cash and cash equivalents. . . . . . . . . . . . . . . . . . . . . . . . . . . . . . . . . . . . . . . 609 747
Restricted cash. . . . . . . . . . . . . . . . . . . . . . . . . . . . . . . . . . . . . . . . . . . . . . . . . . . . 9 7
Total cash balances . . . . . . . . . . . . . . . . . . . . . . . . . . . . . . . . . . . . . . . . . . . . . . . . $ 618 $ 754
We had total cash balances of $618 million at February 2, 2013 and $754 million at January 28, 2012. The
decrease in cash during 2012 was primarily due to uses of cash for contributions to our pension and postretirement
benefit plans of $593 million, capital expenditures of $378 million and repayments of long-term debt of $335
million, partially offset by cash generated from the sale of properties of $532 million and from the separation of
Sears Hometown and Outlet Stores, Inc. of $447 million, as well as reductions in working capital needs.
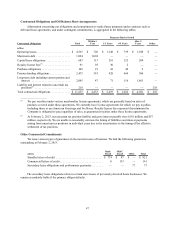
At various times, we have posted cash collateral for certain outstanding letters of credit and self-insurance
programs. Such cash collateral is classified within cash and cash equivalents given we have the ability to substitute
letters of credit at any time for this cash collateral and it is therefore readily available to us.
Our invested cash may include, from time to time, investments in, but not limited to, commercial paper,
federal, state and municipal government securities, floating-rate notes, repurchase agreements and money market
funds. Cash amounts held in these short-term investments are readily available to us.
Credit card deposits in transit include deposits in transit from banks for payments related to third-party credit
card and debit card transactions.
Restricted cash consists of cash related to Sears Canada’s balances, which have been pledged as collateral for
letters of credit obligations issued under its offshore merchandise purchasing program and with counterparties
related to outstanding derivative contracts, as well as funds held in trust in accordance with regulatory requirements
governing advance ticket sales related to Sears Canada’s travel business.
We classify outstanding checks in excess of funds on deposit within other current liabilities and reduce cash
balances when these checks clear the bank on which they were drawn. Outstanding checks in excess of funds on
deposit were $114 million and $68 million as of February 2, 2013 and January 28, 2012, respectively.