Sears 2012 Annual Report Download - page 24
Download and view the complete annual report
Please find page 24 of the 2012 Sears annual report below. You can navigate through the pages in the report by either clicking on the pages listed below, or by using the keyword search tool below to find specific information within the annual report.-
 1
1 -
2
-
3
-
4
-
5
-
6
-
7
-
8
-
9
-
10
-
11
-
12
-
13
-
 14
14 -
 15
15 -
 16
16 -
 17
17 -
 18
18 -
 19
19 -
 20
20 -
 21
21 -
 22
22 -
 23
23 -
 24
24 -
 25
25 -
 26
26 -
 27
27 -
 28
28 -
 29
29 -
 30
30 -
 31
31 -
 32
32 -
 33
33 -
 34
34 -
35
-
36
-
37
-
38
-
39
-
40
-
41
-
42
-
43
-
44
-
45
-
46
-
47
-
48
-
49
-
50
-
51
-
52
-
53
-
54
-
55
-
56
-
57
-
58
-
59
-
60
-
61
-
62
-
63
-
64
-
65
-
66
-
67
-
68
-
69
-
70
-
71
-
72
-
73
-
74
-
75
-
76
-
77
-
78
-
79
-
80
-
81
-
82
-
83
-
84
-
85
-
86
-
87
-
88
-
89
-
90
-
91
-
92
-
93
-
94
-
95
-
96
-
97
-
98
-
99
-
100
-
101
-
102
-
103
-
104
-
105
-
106
-
107
-
108
-
109
-
110
-
111
-
112
-
113
-
114
-
115
-
116
-
117
-
118
-
119
-
120
-
121
-
122
-
123
-
124
-
125
-
126
-
127
-
128
-
129
 |
 |

24
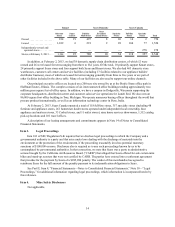
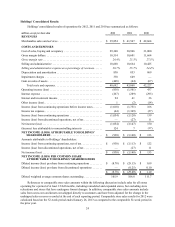
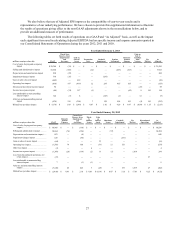
Holdings' Consolidated Results
Holdings' consolidated results of operations for 2012, 2011 and 2010 are summarized as follows:
millions, except per share data 2012 2011 2010
REVENUES
Merchandise sales and services . . . . . . . . . . . . . . . . . . . . . . . . . . . . . . . $ 39,854 $ 41,567 $ 42,664
COSTS AND EXPENSES
Cost of sales, buying and occupancy . . . . . . . . . . . . . . . . . . . . . . . . . . . 29,340 30,966 31,000
Gross margin dollars. . . . . . . . . . . . . . . . . . . . . . . . . . . . . . . . . . . . . . . . 10,514 10,601 11,664
Gross margin rate. . . . . . . . . . . . . . . . . . . . . . . . . . . . . . . . . . . . . . . . . . 26.4% 25.5% 27.3%
Selling and administrative . . . . . . . . . . . . . . . . . . . . . . . . . . . . . . . . . . . 10,660 10,664 10,425
Selling and administrative expense as a percentage of revenues. . . . . . 26.7% 25.7% 24.4%
Depreciation and amortization . . . . . . . . . . . . . . . . . . . . . . . . . . . . . . . . 830 853 869
Impairment charges . . . . . . . . . . . . . . . . . . . . . . . . . . . . . . . . . . . . . . . . 330 649 —
Gain on sales of assets . . . . . . . . . . . . . . . . . . . . . . . . . . . . . . . . . . . . . . (468)(64)(67)
Total costs and expenses . . . . . . . . . . . . . . . . . . . . . . . . . . . . . . . . . 40,692 43,068 42,227
Operating income (loss) . . . . . . . . . . . . . . . . . . . . . . . . . . . . . . . . . . . . . (838)(1,501) 437
Interest expense . . . . . . . . . . . . . . . . . . . . . . . . . . . . . . . . . . . . . . . . . . . (267)(289)(293)
Interest and investment income . . . . . . . . . . . . . . . . . . . . . . . . . . . . . . . 94 41 36
Other income (loss). . . . . . . . . . . . . . . . . . . . . . . . . . . . . . . . . . . . . . . . . 1(2)(14)
Income (loss) from continuing operations before income taxes. . . . . . . (1,010)(1,751) 166
Income tax expense. . . . . . . . . . . . . . . . . . . . . . . . . . . . . . . . . . . . . . . . . (44)(1,369)(27)
Income (loss) from continuing operations . . . . . . . . . . . . . . . . . . . . . . . (1,054)(3,120) 139
Income (loss) from discontinued operations, net of tax . . . . . . . . . . . . . —(27) 11
Net income (loss) . . . . . . . . . . . . . . . . . . . . . . . . . . . . . . . . . . . . . . . . . . (1,054)(3,147) 150
(Income) loss attributable to noncontrolling interests . . . . . . . . . . . . . . 124 7 (17)
NET INCOME (LOSS) ATTRIBUTABLE TO HOLDINGS’
SHAREHOLDERS . . . . . . . . . . . . . . . . . . . . . . . . . . . . . . . . . . . . $(930) $ (3,140) $ 133
Amounts attributable to Holdings’ shareholders:
Income (loss) from continuing operations, net of tax. . . . . . . . . . . . . . . $(930) $ (3,113) $ 122
Income (loss) from discontinued operations, net of tax . . . . . . . . . . . . . —(27) 11
Net income (loss) . . . . . . . . . . . . . . . . . . . . . . . . . . . . . . . . . . . . . . . . . . $(930) $ (3,140) $ 133
NET INCOME (LOSS) PER COMMON SHARE
ATTRIBUTABLE TO HOLDINGS’ SHAREHOLDERS
Diluted income (loss) per share from continuing operations . . . . . . . . . $(8.78) $ (29.15) $ 1.09
Diluted income (loss) per share from discontinued operations . . . . . . . —(0.25) 0.10
$(8.78) $ (29.40) $ 1.19
Diluted weighted average common shares outstanding . . . . . . . . . . . . . 105.9 106.8 111.7
References to comparable store sales amounts within the following discussion include sales for all stores
operating for a period of at least 12 full months, including remodeled and expanded stores, but excluding store
relocations and stores that have undergone format changes. In addition, comparable store sales amounts include
sales from sears.com and kmart.com shipped directly to customers and have been adjusted for the change in the
unshipped sales reserves recorded at the end of each reporting period. Comparable store sales results for 2012 were
calculated based on the 52-week period ended January 26, 2013 as compared to the comparable 52-week period in
the prior year.