Sears 2012 Annual Report Download - page 27
Download and view the complete annual report
Please find page 27 of the 2012 Sears annual report below. You can navigate through the pages in the report by either clicking on the pages listed below, or by using the keyword search tool below to find specific information within the annual report.-
 1
1 -
2
-
3
-
4
-
5
-
6
-
7
-
8
-
9
-
10
-
11
-
12
-
13
-
14
-
15
-
16
-
 17
17 -
 18
18 -
 19
19 -
 20
20 -
 21
21 -
 22
22 -
 23
23 -
 24
24 -
 25
25 -
 26
26 -
 27
27 -
 28
28 -
 29
29 -
 30
30 -
 31
31 -
 32
32 -
 33
33 -
 34
34 -
 35
35 -
 36
36 -
 37
37 -
38
-
39
-
40
-
41
-
42
-
43
-
44
-
45
-
46
-
47
-
48
-
49
-
50
-
51
-
52
-
53
-
54
-
55
-
56
-
57
-
58
-
59
-
60
-
61
-
62
-
63
-
64
-
65
-
66
-
67
-
68
-
69
-
70
-
71
-
72
-
73
-
74
-
75
-
76
-
77
-
78
-
79
-
80
-
81
-
82
-
83
-
84
-
85
-
86
-
87
-
88
-
89
-
90
-
91
-
92
-
93
-
94
-
95
-
96
-
97
-
98
-
99
-
100
-
101
-
102
-
103
-
104
-
105
-
106
-
107
-
108
-
109
-
110
-
111
-
112
-
113
-
114
-
115
-
116
-
117
-
118
-
119
-
120
-
121
-
122
-
123
-
124
-
125
-
126
-
127
-
128
-
129
 |
 |

27
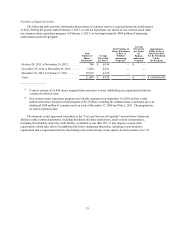
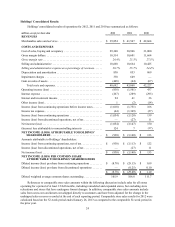
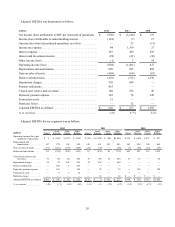
We also believe that use of Adjusted EPS improves the comparability of year-to-year results and is
representative of our underlying performance. We have chosen to provide this supplemental information to illustrate
the results of operations giving effect to the non-GAAP adjustments shown in the reconciliations below, and to
provide an additional measure of performance.
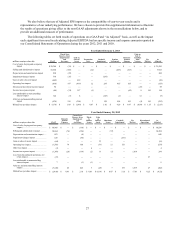
The following tables set forth results of operations on a GAAP and “As Adjusted” basis, as well as the impact
each significant item used in calculating Adjusted EBITDA had on specific income and expense amounts reported in
our Consolidated Statements of Operations during the years 2012, 2011 and 2010.
Year Ended February 2, 2013
millions, except per share data GAAP
Closed Store
Reserve, Store
Impairments
and
Severance
Gain on
Sales of
Assets Transaction
Costs Goodwill
Impairment Pension
Settlements
Domestic
Pension
Expense
Gain on
Sale of
Canadian
Joint
Venture Tax
Matters As
Adjusted
Cost of sales, buying and occupancy
impact $ 29,340 $ (35) $ — $ — $ — $ — $ — $ — $ — $ 29,305
Selling and administrative impact 10,660 (105) — (12) — (455)(165) — — 9,923
Depreciation and amortization impact 830 (22) — — — — — — — 808
Impairment charges impact 330 (35) — — (295) — — — — —
Gain on sales of assets impact (468) — 419 — — — — — — (49)
Operating loss impact (838) 197 (419) 12 295 455 165 — — (133)
Interest and investment income impact 94 — — — — — — (25) — 69
Income tax expense impact (44) (74) 157 (5) — — (62) 9 143 124
Loss attributable to noncontrolling
interest impact 124 (7) 8 — (145)(1) — 12 — (9)
After tax and noncontrolling interest
impact (930) 116 (254) 7 150 454 103 (4) 143 (215)
Diluted loss per share impact $ (8.78) $ 1.09 $ (2.40) $ 0.07 $ 1.42 $ 4.29 $ 0.97 $ (0.04) $ 1.35 $ (2.03)
Year Ended January 28, 2012
millions, except per share data GAAP
Domestic
Pension
Expense
Closed Store
Reserve, Store
Impairments
and
Severance
Mark-
to-
Market
Losses
Gain
on
Sales of
Assets Hurricane
Losses Goodwill
Impairment Tax
Matters Discontinued
Operations As
Adjusted
Cost of sales, buying and occupancy
impact . . . . . . . . . . . . . . . . . . . . . . . . $ 30,966 $ — $ (130) $ — $ — $ — $ — $ — $ — $ 30,836
Selling and administrative impact . . . . . . 10,664 (74) (124) — — (12) — — — 10,454
Depreciation and amortization impact . . . 853 — (8) — — — — — — 845
Impairment charges impact . . . . . . . . . . . 649 — (98) — — — (551) — — —
Gain on sales of assets impact . . . . . . . . . (64) — — — 33 — — — — (31)
Operating loss impact. . . . . . . . . . . . . . . . (1,501) 74 360 — (33) 12 551 — — (537)
Other loss impact . . . . . . . . . . . . . . . . . . . (2) — — 6 — — — — — 4
Income tax expense impact . . . . . . . . . . . (1,369) (28) (134) (2) 13 (5) — 1,819 — 294
Loss from discontinued operations, net
of tax impact. . . . . . . . . . . . . . . . . . . (27) — — — — — — — 27 —
Loss attributable to noncontrolling
interest impact . . . . . . . . . . . . . . . . . 7 — (1) (1) — — — — — 5
After tax and noncontrolling interest
impact . . . . . . . . . . . . . . . . . . . . . . . . (3,140) 46 225 3 (20) 7 551 1,819 27 (482)
Diluted loss per share impact. . . . . . . . . . $ (29.40) $ 0.43 $ 2.10 $ 0.03 $ (0.19) $ 0.07 $ 5.16 $ 17.03 $ 0.25 $ (4.52)