Sears 2012 Annual Report Download - page 30
Download and view the complete annual report
Please find page 30 of the 2012 Sears annual report below. You can navigate through the pages in the report by either clicking on the pages listed below, or by using the keyword search tool below to find specific information within the annual report.-
 1
1 -
2
-
3
-
4
-
5
-
6
-
7
-
8
-
9
-
10
-
11
-
12
-
13
-
14
-
15
-
16
-
17
-
18
-
19
-
 20
20 -
 21
21 -
 22
22 -
 23
23 -
 24
24 -
 25
25 -
 26
26 -
 27
27 -
 28
28 -
 29
29 -
 30
30 -
 31
31 -
 32
32 -
 33
33 -
 34
34 -
 35
35 -
 36
36 -
 37
37 -
 38
38 -
 39
39 -
 40
40 -
41
-
42
-
43
-
44
-
45
-
46
-
47
-
48
-
49
-
50
-
51
-
52
-
53
-
54
-
55
-
56
-
57
-
58
-
59
-
60
-
61
-
62
-
63
-
64
-
65
-
66
-
67
-
68
-
69
-
70
-
71
-
72
-
73
-
74
-
75
-
76
-
77
-
78
-
79
-
80
-
81
-
82
-
83
-
84
-
85
-
86
-
87
-
88
-
89
-
90
-
91
-
92
-
93
-
94
-
95
-
96
-
97
-
98
-
99
-
100
-
101
-
102
-
103
-
104
-
105
-
106
-
107
-
108
-
109
-
110
-
111
-
112
-
113
-
114
-
115
-
116
-
117
-
118
-
119
-
120
-
121
-
122
-
123
-
124
-
125
-
126
-
127
-
128
-
129
 |
 |
30
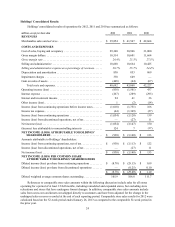
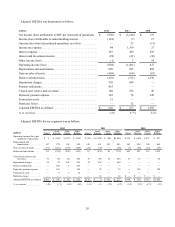
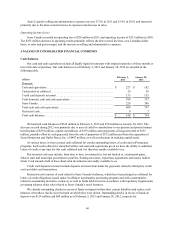
the gain on sales of assets included a gain of $21 million recognized on the sale of two stores operated under The
Great Indoors format and $12 million recognized on the sale of a store operated under the Kmart format.
Operating Loss
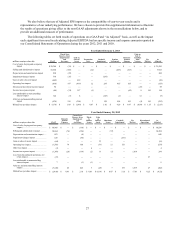
We recorded an operating loss of $838 million and $1.5 billion in 2012 and 2011, respectively. Operating loss
for 2012 included non-cash charges related to pension settlements and the impairment of Sears Canada goodwill
balances, expenses related to domestic pension plans, store closings and store impairments and severance and
transaction costs, as well as the gains on sales of assets which aggregated to $705 million. Operating loss for 2011
included a non-cash charge of $551 million related to goodwill balances of certain reporting units, expenses related
to domestic pension plans, store closings, severance and hurricane losses and a net gain on the sales of assets which
aggregated to $964 million. Excluding these items, operating loss improved $404 million primarily due to the
improvement in gross margin rate and a decrease in selling and administrative expenses, which were partially offset
by a decline in gross margin dollars, given lower sales.
Interest Expense
We incurred $267 million and $289 million in interest expense during 2012 and 2011, respectively. The
decrease is due to lower average outstanding borrowings.
Income Taxes
Our income tax effective rate was 4.4% in 2012 and 78.2% in 2011. The 2012 tax rate continues to reflect the
effect of not recognizing the benefit of current period losses in certain domestic jurisdictions where it is not more
likely than not that such benefits will be realized. The prior year tax rate is the result of significant tax matters in
2011 which included a non-cash charge of $1.8 billion to establish a valuation allowance against certain deferred
income tax assets.
2011 Compared to 2010
Net Income (Loss) from Continuing Operations Attributable to Holdings' Shareholders
We recorded a net loss from continuing operations attributable to Holdings' shareholders of $3.1 billion
($29.15 loss per diluted share from continuing operations) for 2011, as compared to net income from continuing
operations of $122 million ($1.09 per diluted share from continuing operations) in 2010. Our results for 2011 and
2010 were affected by a number of significant items, including a $1.8 billion non-cash charge to establish a
valuation allowance against our domestic deferred tax assets in 2011. Our net loss from continuing operations as
adjusted for these significant items was $482 million ($4.52 loss per diluted share from continuing operations) for
2011 and our net income from continuing operations adjusted for these similar significant items was $220 million
($1.97 per diluted share from continuing operations) for 2010. The decrease in net income for the year reflected a
decrease in operating income of $1.9 billion, including the impact of non-cash impairment charges and charges
related to store closures. Excluding these items, operating income declined $1.1 billion, primarily related to a
decline in our gross margin dollars, given lower sales, and a decline in gross margin rate of 180 basis points, and an
increase in selling and administrative expenses.
Revenues and Comparable Store Sales
Revenues decreased $1.1 billion, or 2.6%, to $41.6 billion in 2011, as compared to revenues of $42.7 billion in
2010. The decline in revenues was primarily a result of a 2.2% decrease in domestic comparable stores sales and the
effect of having fewer Kmart and Sears Full-line stores in operation. Additionally, Sears Canada had a 7.7% decline
in comparable store sales, which was partially offset by an increase of $171 million due to changes in the Canadian
foreign exchange rate.
For the year, domestic comparable store sales declined 2.2%, with declines of 3.0% at Sears Domestic and
1.4% at Kmart. Decreases in sales at Sears Domestic were driven by appliances and consumer electronics, and were
partially offset by increases in the home category. The Kmart declines in comparable store sales included decreases