Sears 2012 Annual Report Download - page 18
Download and view the complete annual report
Please find page 18 of the 2012 Sears annual report below. You can navigate through the pages in the report by either clicking on the pages listed below, or by using the keyword search tool below to find specific information within the annual report.-
 1
1 -
2
-
3
-
4
-
5
-
6
-
7
-
 8
8 -
 9
9 -
 10
10 -
 11
11 -
 12
12 -
 13
13 -
 14
14 -
 15
15 -
 16
16 -
 17
17 -
 18
18 -
 19
19 -
 20
20 -
 21
21 -
 22
22 -
 23
23 -
 24
24 -
 25
25 -
 26
26 -
 27
27 -
 28
28 -
29
-
30
-
31
-
32
-
33
-
34
-
35
-
36
-
37
-
38
-
39
-
40
-
41
-
42
-
43
-
44
-
45
-
46
-
47
-
48
-
49
-
50
-
51
-
52
-
53
-
54
-
55
-
56
-
57
-
58
-
59
-
60
-
61
-
62
-
63
-
64
-
65
-
66
-
67
-
68
-
69
-
70
-
71
-
72
-
73
-
74
-
75
-
76
-
77
-
78
-
79
-
80
-
81
-
82
-
83
-
84
-
85
-
86
-
87
-
88
-
89
-
90
-
91
-
92
-
93
-
94
-
95
-
96
-
97
-
98
-
99
-
100
-
101
-
102
-
103
-
104
-
105
-
106
-
107
-
108
-
109
-
110
-
111
-
112
-
113
-
114
-
115
-
116
-
117
-
118
-
119
-
120
-
121
-
122
-
123
-
124
-
125
-
126
-
127
-
128
-
129
 |
 |

18
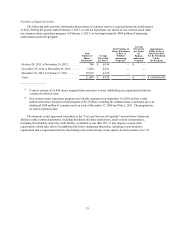
Stock Performance Graph
Comparison of Five-Year Cumulative Stockholder Return
The following graph compares the cumulative total return to stockholders on Holdings' common stock from
February 1, 2008 through February 1, 2013, the last trading day before the end of our 2012 year, with the return on
the S&P 500 Stock Index, the S&P 500 Retailing Index and the S&P 500 Department Stores Index for the same
period. The graph assumes an initial investment of $100 on February 1, 2008 in each of our common stock, the S&P
500 Stock Index, the S&P Retailing Index and the S&P 500 Department Stores Index.
The S&P 500 Retailing Index consists of companies included in the S&P 500 Stock Index in the broadly
defined retail sector, which includes competing retailers of softlines (apparel and domestics) and hardlines
(appliances, electronics and home improvement products), as well as food and drug retailers. The S&P 500
Department Stores Index consists primarily of department stores that compete with our full-line stores.
Feb. 1,
2008 Jan. 30,
2009 Jan. 29,
2010 Jan. 28,
2011 Jan. 27,
2012 Feb. 1,
2013
Sears Holdings . . . . . . . . . . . . . . . . . . . . . . . $100.00 $ 37.78 $ 86.12 $ 70.24 $ 41.55 $ 49.89
S&P 500 Stock Index . . . . . . . . . . . . . . . . . . $100.00 $ 60.64 $ 80.72 $ 97.89 $103.10 $121.25
S&P 500 Retailing Index. . . . . . . . . . . . . . . . $100.00 $ 62.28 $ 96.85 $123.37 $140.16 $178.46
S&P 500 Department Stores Index. . . . . . . . $100.00 $ 47.25 $ 78.97 $ 90.57 $102.24 $105.40