Sears 2012 Annual Report Download - page 32
Download and view the complete annual report
Please find page 32 of the 2012 Sears annual report below. You can navigate through the pages in the report by either clicking on the pages listed below, or by using the keyword search tool below to find specific information within the annual report.-
 1
1 -
2
-
3
-
4
-
5
-
6
-
7
-
8
-
9
-
10
-
11
-
12
-
13
-
14
-
15
-
16
-
17
-
18
-
19
-
20
-
21
-
 22
22 -
 23
23 -
 24
24 -
 25
25 -
 26
26 -
 27
27 -
 28
28 -
 29
29 -
 30
30 -
 31
31 -
 32
32 -
 33
33 -
 34
34 -
 35
35 -
 36
36 -
 37
37 -
 38
38 -
 39
39 -
 40
40 -
 41
41 -
 42
42 -
43
-
44
-
45
-
46
-
47
-
48
-
49
-
50
-
51
-
52
-
53
-
54
-
55
-
56
-
57
-
58
-
59
-
60
-
61
-
62
-
63
-
64
-
65
-
66
-
67
-
68
-
69
-
70
-
71
-
72
-
73
-
74
-
75
-
76
-
77
-
78
-
79
-
80
-
81
-
82
-
83
-
84
-
85
-
86
-
87
-
88
-
89
-
90
-
91
-
92
-
93
-
94
-
95
-
96
-
97
-
98
-
99
-
100
-
101
-
102
-
103
-
104
-
105
-
106
-
107
-
108
-
109
-
110
-
111
-
112
-
113
-
114
-
115
-
116
-
117
-
118
-
119
-
120
-
121
-
122
-
123
-
124
-
125
-
126
-
127
-
128
-
129
 |
 |

32
Operating Income (Loss)
We recorded an operating loss of $1.5 billion in 2011, as compared to operating income of $437 million in
2010. Operating loss for 2011 included a $551 million non-cash impairment charge related to goodwill balances of
certain reporting units, expenses related to domestic pension plans, store closings, severance and hurricane losses,
and a net gain on sales of assets, which aggregated to $964 million. Operating income for 2010 included expenses
related to domestic pension plans, store closings and severance and a gain on sale of assets, which aggregated to
$121 million. The decline in operating income of $1.9 billion was primarily the result of a decline in our gross
margin dollars, given lower overall sales, and a decline in our gross margin rate of 180 basis points and an increase
in the above noted charges.
Other Loss
Other loss is primarily comprised of mark-to-market and settlement gains and losses on Sears Canada hedge
transactions. Total net mark-to-market and settlement losses of $1 million and $15 million were recorded on these
transactions in 2011 and 2010, respectively. See Notes 4 and 5 to the Consolidated Financial Statements for further
information regarding these transactions.
Income Taxes
Our income tax expense effective tax rate for the year was 78.2% in 2011 and 16.3% in 2010. The increase in
our tax rate was primarily due to several significant tax matters, which included a non-cash charge of $1.8 billion to
establish a valuation allowance against certain deferred income tax assets and the nondeductible nature of our
goodwill impairment.
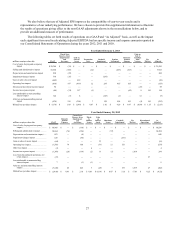
Business Segment Results
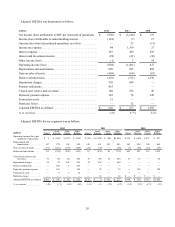
Kmart
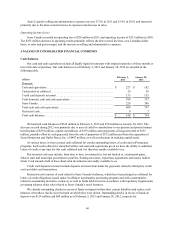
Kmart results and key statistics were as follows:
millions, except number of stores 2012 2011 2010
Merchandise sales and services. . . . . . . . . . . . . . . . . . . . . . . . . . . . . . . . $ 14,567 $ 15,285 $ 15,593
Comparable store sales %. . . . . . . . . . . . . . . . . . . . . . . . . . . . . . . . . . . . (3.7)% (1.4)% 0.8%
Cost of sales, buying and occupancy. . . . . . . . . . . . . . . . . . . . . . . . . . . . 11,158 11,818 11,757
Gross margin dollars . . . . . . . . . . . . . . . . . . . . . . . . . . . . . . . . . . . . . . . . 3,409 3,467 3,836
Gross margin rate . . . . . . . . . . . . . . . . . . . . . . . . . . . . . . . . . . . . . . . . . . 23.4 % 22.7 % 24.6%
Selling and administrative. . . . . . . . . . . . . . . . . . . . . . . . . . . . . . . . . . . . 3,284 3,371 3,341
Selling and administrative expense as a percentage of revenues . . . . . . 22.5 % 22.1 % 21.4%
Depreciation and amortization . . . . . . . . . . . . . . . . . . . . . . . . . . . . . . . . 147 149 149
Impairment charges . . . . . . . . . . . . . . . . . . . . . . . . . . . . . . . . . . . . . . . . . 10 15 —
Gain on sales of assets. . . . . . . . . . . . . . . . . . . . . . . . . . . . . . . . . . . . . . . (37) (34) (7)
Total costs and expenses. . . . . . . . . . . . . . . . . . . . . . . . . . . . . . . . . . 14,562 15,319 15,240
Operating income (loss) . . . . . . . . . . . . . . . . . . . . . . . . . . . . . . . . . . . . . $ 5 $ (34) $ 353
Adjusted EBITDA. . . . . . . . . . . . . . . . . . . . . . . . . . . . . . . . . . . . . . . . . . $ 201 $ 172 $ 508
Total Kmart stores . . . . . . . . . . . . . . . . . . . . . . . . . . . . . . . . . . . . . . . . . . 1,221 1,305 1,307