Sears 2012 Annual Report Download - page 59
Download and view the complete annual report
Please find page 59 of the 2012 Sears annual report below. You can navigate through the pages in the report by either clicking on the pages listed below, or by using the keyword search tool below to find specific information within the annual report.-
 1
1 -
2
-
3
-
4
-
5
-
6
-
7
-
8
-
9
-
10
-
11
-
12
-
13
-
14
-
15
-
16
-
17
-
18
-
19
-
20
-
21
-
22
-
23
-
24
-
25
-
26
-
27
-
28
-
29
-
30
-
31
-
32
-
33
-
34
-
35
-
36
-
37
-
38
-
39
-
40
-
41
-
42
-
43
-
44
-
45
-
46
-
47
-
48
-
 49
49 -
 50
50 -
 51
51 -
 52
52 -
 53
53 -
 54
54 -
 55
55 -
 56
56 -
 57
57 -
 58
58 -
 59
59 -
 60
60 -
 61
61 -
 62
62 -
 63
63 -
 64
64 -
 65
65 -
 66
66 -
 67
67 -
 68
68 -
 69
69 -
70
-
71
-
72
-
73
-
74
-
75
-
76
-
77
-
78
-
79
-
80
-
81
-
82
-
83
-
84
-
85
-
86
-
87
-
88
-
89
-
90
-
91
-
92
-
93
-
94
-
95
-
96
-
97
-
98
-
99
-
100
-
101
-
102
-
103
-
104
-
105
-
106
-
107
-
108
-
109
-
110
-
111
-
112
-
113
-
114
-
115
-
116
-
117
-
118
-
119
-
120
-
121
-
122
-
123
-
124
-
125
-
126
-
127
-
128
-
129
 |
 |

59
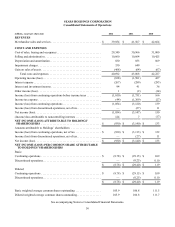
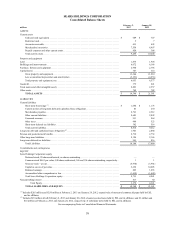
SEARS HOLDINGS CORPORATION
Consolidated Statements of Cash Flows
millions 2012 2011 2010
CASH FLOWS FROM OPERATING ACTIVITIES
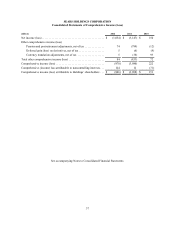
Net income (loss). . . . . . . . . . . . . . . . . . . . . . . . . . . . . . . . . . . . . . . . . . . . . . . . . . . . . . . . . . . . . . . . . . . $ (1,054) $ (3,147) $ 150
(Income) loss from discontinued operations, net of tax. . . . . . . . . . . . . . . . . . . . . . . . . . . . . . . . . . . . . . — 27 (11)
Income (loss) from continuing operations. . . . . . . . . . . . . . . . . . . . . . . . . . . . . . . . . . . . . . . . . . . . . . . . (1,054) (3,120) 139
Adjustments to reconcile net income (loss) to net cash provided by (used in) operating activities:
Deferred tax valuation allowance . . . . . . . . . . . . . . . . . . . . . . . . . . . . . . . . . . . . . . . . . . . . . . . . . . 237 1,798 —
Depreciation and amortization . . . . . . . . . . . . . . . . . . . . . . . . . . . . . . . . . . . . . . . . . . . . . . . . . . . . 830 853 869
Impairment charges. . . . . . . . . . . . . . . . . . . . . . . . . . . . . . . . . . . . . . . . . . . . . . . . . . . . . . . . . . . . . 330 649 —
Gain on sales of assets . . . . . . . . . . . . . . . . . . . . . . . . . . . . . . . . . . . . . . . . . . . . . . . . . . . . . . . . . . (468) (64) (67)
Gain on sales of investments. . . . . . . . . . . . . . . . . . . . . . . . . . . . . . . . . . . . . . . . . . . . . . . . . . . . . . (28) — —
Pension and postretirement plan contributions. . . . . . . . . . . . . . . . . . . . . . . . . . . . . . . . . . . . . . . . (593) (390) (316)
Pension and postretirement plan settlements . . . . . . . . . . . . . . . . . . . . . . . . . . . . . . . . . . . . . . . . . 455 — —
Settlement of Canadian dollar hedges. . . . . . . . . . . . . . . . . . . . . . . . . . . . . . . . . . . . . . . . . . . . . . . 6 — (3)
Change in operating assets and liabilities (net of acquisitions and dispositions):
Deferred income taxes . . . . . . . . . . . . . . . . . . . . . . . . . . . . . . . . . . . . . . . . . . . . . . . . . . . . . . (206) (533) (15)
Merchandise inventories . . . . . . . . . . . . . . . . . . . . . . . . . . . . . . . . . . . . . . . . . . . . . . . . . . . . 427 545 (353)
Merchandise payables . . . . . . . . . . . . . . . . . . . . . . . . . . . . . . . . . . . . . . . . . . . . . . . . . . . . . . (117) (134) (285)
Income and other taxes . . . . . . . . . . . . . . . . . . . . . . . . . . . . . . . . . . . . . . . . . . . . . . . . . . . . . (63) (50) (34)
Mark-to-market adjustments and settlements on Sears Canada U.S. dollar collar contracts 1 2 7
Other operating assets . . . . . . . . . . . . . . . . . . . . . . . . . . . . . . . . . . . . . . . . . . . . . . . . . . . . . . (100) 67 (7)
Other operating liabilities . . . . . . . . . . . . . . . . . . . . . . . . . . . . . . . . . . . . . . . . . . . . . . . . . . . 40 70 142
Net cash provided by (used in) operating activities—continuing operations . . . . . . . . . . . . (303) (307) 77
Net cash provided by operating activities—discontinued operations . . . . . . . . . . . . . . . . . . — 32 46
Net cash provided by (used in) operating activities . . . . . . . . . . . . . . . . . . . . . . . . . . . . . . . . . . . . (303) (275) 123
CASH FLOWS FROM INVESTING ACTIVITIES
Proceeds from sales of property and investments. . . . . . . . . . . . . . . . . . . . . . . . . . . . . . . . . . . . . . 532 72 35
Net decrease in investments and restricted cash. . . . . . . . . . . . . . . . . . . . . . . . . . . . . . . . . . . . . . . 37 8 —
Purchases of property and equipment. . . . . . . . . . . . . . . . . . . . . . . . . . . . . . . . . . . . . . . . . . . . . . . (378) (432) (426)
Net cash provided by (used in) investing activities—continuing operations . . . . . . . . . . . . 191 (352) (391)
Net cash provided by (used in) investing activities—discontinued operations. . . . . . . . . . . — 43 (15)
Net cash provided by (used in) investing activities . . . . . . . . . . . . . . . . . . . . . . . . . . . . . . . . . . . . 191 (309) (406)
CASH FLOWS FROM FINANCING ACTIVITIES
Proceeds from debt issuances . . . . . . . . . . . . . . . . . . . . . . . . . . . . . . . . . . . . . . . . . . . . . . . . . . . . . 5 104 1,353
Repayments of long-term debt . . . . . . . . . . . . . . . . . . . . . . . . . . . . . . . . . . . . . . . . . . . . . . . . . . . . (335) (611) (358)
Increase (decrease) in short-term borrowings, primarily 90 days or less . . . . . . . . . . . . . . . . . . . . (81) 815 35
Sears Hometown and Outlet Stores, Inc. pre-separation funding. . . . . . . . . . . . . . . . . . . . . . . . . . 100 — —
Proceeds from the sale of Sears Hometown and Outlet Stores, Inc.. . . . . . . . . . . . . . . . . . . . . . . . 347 — —
Debt issuance costs . . . . . . . . . . . . . . . . . . . . . . . . . . . . . . . . . . . . . . . . . . . . . . . . . . . . . . . . . . . . . (3) (35) (28)
Purchase of Sears Canada shares . . . . . . . . . . . . . . . . . . . . . . . . . . . . . . . . . . . . . . . . . . . . . . . . . . (10) (43) (603)
Sears Canada dividends paid to minority shareholders . . . . . . . . . . . . . . . . . . . . . . . . . . . . . . . . . (50) — (69)
Purchase of treasury stock . . . . . . . . . . . . . . . . . . . . . . . . . . . . . . . . . . . . . . . . . . . . . . . . . . . . . . . — (183) (394)
Net cash provided by (used in) financing activities—continuing operations . . . . . . . . . . . . (27) 47 (64)
Net cash used in financing activities—discontinued operations . . . . . . . . . . . . . . . . . . . . . . — (75) (31)
Net cash used in financing activities . . . . . . . . . . . . . . . . . . . . . . . . . . . . . . . . . . . . . (27) (28) (95)
Effect of exchange rate changes on cash and cash equivalents . . . . . . . . . . . . . . . . . . . . . . . . . . . . . . . . 1 — 57
NET DECREASE IN CASH AND CASH EQUIVALENTS. . . . . . . . . . . . . . . . . . . . . . . . . . . . . . . . . (138) (612) (321)
CASH AND CASH EQUIVALENTS, BEGINNING OF YEAR. . . . . . . . . . . . . . . . . . . . . . . . . . . . 747 1,359 1,680
CASH AND CASH EQUIVALENTS, END OF YEAR. . . . . . . . . . . . . . . . . . . . . . . . . . . . . . . . . . . $ 609 $ 747 $ 1,359
SUPPLEMENTAL INFORMATION:
Capital lease obligation incurred . . . . . . . . . . . . . . . . . . . . . . . . . . . . . . . . . . . . . . . . . . . . . . . . . . . . . . . $ 61 $ 3 $ 15
Supplemental Cash Flow Data:
Income taxes paid, net of refunds . . . . . . . . . . . . . . . . . . . . . . . . . . . . . . . . . . . . . . . . . . . . . . . . . . $ 40 $ 94 $ 47
Cash interest paid . . . . . . . . . . . . . . . . . . . . . . . . . . . . . . . . . . . . . . . . . . . . . . . . . . . . . . . . . . . . . . 199 223 164
Unpaid liability to acquire equipment and software. . . . . . . . . . . . . . . . . . . . . . . . . . . . . . . . . . . . 30 52 56
Non-cash dividend in connection with Spin-Off transactions . . . . . . . . . . . . . . . . . . . . . . . . . . . . (542) (74) —
See accompanying Notes to Consolidated Financial Statements.