Sears 2012 Annual Report Download - page 35
Download and view the complete annual report
Please find page 35 of the 2012 Sears annual report below. You can navigate through the pages in the report by either clicking on the pages listed below, or by using the keyword search tool below to find specific information within the annual report.-
 1
1 -
2
-
3
-
4
-
5
-
6
-
7
-
8
-
9
-
10
-
11
-
12
-
13
-
14
-
15
-
16
-
17
-
18
-
19
-
20
-
21
-
22
-
23
-
24
-
 25
25 -
 26
26 -
 27
27 -
 28
28 -
 29
29 -
 30
30 -
 31
31 -
 32
32 -
 33
33 -
 34
34 -
 35
35 -
 36
36 -
 37
37 -
 38
38 -
 39
39 -
 40
40 -
 41
41 -
 42
42 -
 43
43 -
 44
44 -
 45
45 -
46
-
47
-
48
-
49
-
50
-
51
-
52
-
53
-
54
-
55
-
56
-
57
-
58
-
59
-
60
-
61
-
62
-
63
-
64
-
65
-
66
-
67
-
68
-
69
-
70
-
71
-
72
-
73
-
74
-
75
-
76
-
77
-
78
-
79
-
80
-
81
-
82
-
83
-
84
-
85
-
86
-
87
-
88
-
89
-
90
-
91
-
92
-
93
-
94
-
95
-
96
-
97
-
98
-
99
-
100
-
101
-
102
-
103
-
104
-
105
-
106
-
107
-
108
-
109
-
110
-
111
-
112
-
113
-
114
-
115
-
116
-
117
-
118
-
119
-
120
-
121
-
122
-
123
-
124
-
125
-
126
-
127
-
128
-
129
 |
 |

35
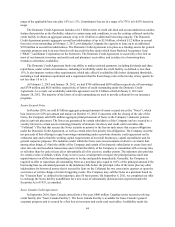
Sears Domestic
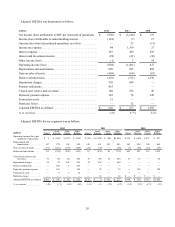
Sears Domestic results and key statistics were as follows:
millions, except number of stores 2012 2011 2010
Merchandise sales and services. . . . . . . . . . . . . . . . . . . . . . . . . . . . . . . . $ 20,977 $ 21,649 $ 22,275
Comparable store sales %. . . . . . . . . . . . . . . . . . . . . . . . . . . . . . . . . . . . (1.4)% (3.0)% (3.1)%
Cost of sales, buying and occupancy. . . . . . . . . . . . . . . . . . . . . . . . . . . . 15,107 15,849 15,910
Gross margin dollars . . . . . . . . . . . . . . . . . . . . . . . . . . . . . . . . . . . . . . . . 5,870 5,800 6,365
Gross margin rate . . . . . . . . . . . . . . . . . . . . . . . . . . . . . . . . . . . . . . . . . . 28.0 % 26.8 % 28.6 %
Selling and administrative. . . . . . . . . . . . . . . . . . . . . . . . . . . . . . . . . . . . 6,184 6,042 5,940
Selling and administrative expense as a percentage of revenues . . . . . . 29.5 % 27.9 % 26.7 %
Depreciation and amortization . . . . . . . . . . . . . . . . . . . . . . . . . . . . . . . . 578 601 620
Impairment charges . . . . . . . . . . . . . . . . . . . . . . . . . . . . . . . . . . . . . . . . . 25 634 —
Gain on sales of assets. . . . . . . . . . . . . . . . . . . . . . . . . . . . . . . . . . . . . . . (261) (30) (46)
Total costs and expenses. . . . . . . . . . . . . . . . . . . . . . . . . . . . . . . . . . 21,633 23,096 22,424
Operating loss . . . . . . . . . . . . . . . . . . . . . . . . . . . . . . . . . . . . . . . . . . . . . $ (656) $ (1,447) $ (149)
Adjusted EBITDA. . . . . . . . . . . . . . . . . . . . . . . . . . . . . . . . . . . . . . . . . . $ 356 $ 4 $ 558
Number of:
Full-line stores(1) . . . . . . . . . . . . . . . . . . . . . . . . . . . . . . . . . . . . 798 867 894
Specialty stores(2) . . . . . . . . . . . . . . . . . . . . . . . . . . . . . . . . . . . 54 1,338 1,265
Total Domestic Sears Stores . . . . . . . . . . . . . . . . . . . . . . . . . . . 852 2,205 2,159
__________________
(1) 2012 included 788 Full-line stores and 10 Sears Essentials/Grand stores; 2011 included 834 Full-line stores
and 33 Sears Essentials/Grand stores; 2010 included 842 Full-line stores and 52 Sears Essentials/Grand
stores
(2) 2011 and 2010 included 1,273 and 1,205 stores, respectively, of Sears Hometown and Outlet Stores, Inc.
2012 Compared to 2011
Revenues and Comparable Store Sales
Sears Domestic’s revenues decreased by $672 million as comparable store sales decreased 1.4%. The decline
in revenue is mainly due to the impact of having fewer Sears Full-line stores in operation, the decline in comparable
store sales and the separation of the Sears Hometown and Outlet businesses, partially offset by the inclusion of
approximately $275 million of revenues recorded in the 53rd week of 2012. The separation of the Sears Hometown
and Outlet businesses resulted in a net decrease in revenues of approximately $100 million.
The decrease of 1.4% in comparable store sales was driven by decreases in the consumer electronics, lawn and
garden and home appliances categories, as well as at Sears Auto Centers. These decreases were partially offset by
increases in apparel and home. Consumer electronics continues to be negatively impacted by price compression, as
well as market shifts such as moves to smartphone technology and away from digital cameras, GPS devices, MP3
Players and camcorders in addition to transitions to online gaming and applications. Excluding the consumer
electronics category, Sears Domestic comparable stores sales decreased only 0.1%.
Gross Margin
Sears Domestic generated gross margin dollars of $5.9 billion in 2012 and $5.8 billion in 2011 as the decline in
revenues in 2012 noted above was offset by an improvement in gross margin rate. Gross margin for 2012 and 2011
included charges of $14 million and $84 million, respectively, for markdowns recorded in connection with store
closings.