Sears 2012 Annual Report Download - page 37
Download and view the complete annual report
Please find page 37 of the 2012 Sears annual report below. You can navigate through the pages in the report by either clicking on the pages listed below, or by using the keyword search tool below to find specific information within the annual report.-
 1
1 -
2
-
3
-
4
-
5
-
6
-
7
-
8
-
9
-
10
-
11
-
12
-
13
-
14
-
15
-
16
-
17
-
18
-
19
-
20
-
21
-
22
-
23
-
24
-
25
-
26
-
 27
27 -
 28
28 -
 29
29 -
 30
30 -
 31
31 -
 32
32 -
 33
33 -
 34
34 -
 35
35 -
 36
36 -
 37
37 -
 38
38 -
 39
39 -
 40
40 -
 41
41 -
 42
42 -
 43
43 -
 44
44 -
 45
45 -
 46
46 -
 47
47 -
48
-
49
-
50
-
51
-
52
-
53
-
54
-
55
-
56
-
57
-
58
-
59
-
60
-
61
-
62
-
63
-
64
-
65
-
66
-
67
-
68
-
69
-
70
-
71
-
72
-
73
-
74
-
75
-
76
-
77
-
78
-
79
-
80
-
81
-
82
-
83
-
84
-
85
-
86
-
87
-
88
-
89
-
90
-
91
-
92
-
93
-
94
-
95
-
96
-
97
-
98
-
99
-
100
-
101
-
102
-
103
-
104
-
105
-
106
-
107
-
108
-
109
-
110
-
111
-
112
-
113
-
114
-
115
-
116
-
117
-
118
-
119
-
120
-
121
-
122
-
123
-
124
-
125
-
126
-
127
-
128
-
129
 |
 |
37
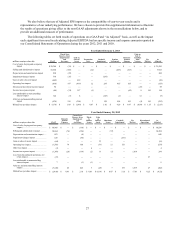
2011 Compared to 2010
Revenues and Comparable Store Sales
Sears Domestic's total sales decreased by $626 million to $21.6 billion in 2011, as comparable store sales
decreased 3.0%. The decline in revenue was mainly due to the decrease in comparable store sales, as well as the
impact of having fewer Sears Full-line stores in operation. The decrease in comparable store sales was primarily
driven by declines in the appliances and consumer electronics categories, and were partially offset by an increase in
the home category.
Gross Margin
Sears Domestic generated gross margin dollars of $5.8 billion in 2011 and $6.4 billion in 2010. The decrease
of $565 million was mainly a result of a decline in Sears Domestic's gross margin rate during 2011 and included
charges of $84 million and $6 million for markdowns recorded in connection with store closings announced during
2011 and 2010, respectively.
Sears Domestic's gross margin rate was 26.8% in 2011 and 28.6% in 2010. The decline of 180 basis points
was primarily due to reduced margins in the home appliance, consumer electronics, and Lands' End categories and
declines in home services.
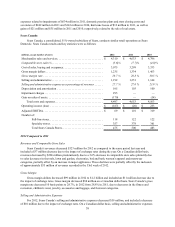
Selling and Administrative Expenses
Sears Domestic's selling and administrative expenses increased $102 million to $6.0 billion in 2011. The
increase was mainly due to increases in insurance and store closing expenses. Selling and administrative expenses
included domestic pension plan expense of $74 million in 2011 and $120 million in 2010, store closing costs and
severance of $76 in 2011 and $7 million in 2010, and hurricane losses of $12 million in 2011.
Our selling and administrative expense rate was 27.9% for 2011 and 26.7% for 2010, and increased due to the
above noted increase in expense and decline in sales.
Depreciation and Amortization
Depreciation and amortization expense decreased by $19 million to $601 million during 2011, and included
charges of $8 million and $10 million in 2011 and 2010, respectively, taken in connection with store closings. The
decrease is primarily attributable to having fewer assets available for depreciation.
Gain on Sales of Assets
Sears Domestic recorded a total net gain on sales of assets of $30 million in 2011 and $46 million in 2010. The
gains on sales of assets in 2011 included a gain of $21 million recognized on the sale of two stores operated under
The Great Indoors format. The gain on sales of assets in 2010 was due to the recognition of a previously deferred
gain from the October 2006 sale of one of our Sears Auto Centers. At the time of the sale, we leased back the
property for a period of time. Given the terms of the contract, for accounting purposes, the excess of proceeds
received over the carrying value of the associated property was deferred. We closed our operations at this location
during the first quarter of 2010 and, as a result, recognized a gain of $35 million on this sale at that time.
Impairment Charges
We recorded impairment charges of $551 million and $83 million during 2011 related to impairment of
goodwill and long-lived assets, respectively. We did not record any such impairments in 2010. Impairment charges
recorded during 2011 are further described in Notes 12 and 13 in Notes to Consolidated Financial Statements.
Operating Loss
Sears Domestic reported an operating loss of $1.4 billion in 2011 and $149 million in 2010. The increase in
Sears Domestic's operating loss was primarily the result of lower gross margin dollars, driven by declines in the
gross margin rate and revenues, and the impairment charges noted above. Sears Domestic's operating loss included