Sears 2012 Annual Report Download - page 108
Download and view the complete annual report
Please find page 108 of the 2012 Sears annual report below. You can navigate through the pages in the report by either clicking on the pages listed below, or by using the keyword search tool below to find specific information within the annual report.-
 1
1 -
2
-
3
-
4
-
5
-
6
-
7
-
8
-
9
-
10
-
11
-
12
-
13
-
14
-
15
-
16
-
17
-
18
-
19
-
20
-
21
-
22
-
23
-
24
-
25
-
26
-
27
-
28
-
29
-
30
-
31
-
32
-
33
-
34
-
35
-
36
-
37
-
38
-
39
-
40
-
41
-
42
-
43
-
44
-
45
-
46
-
47
-
48
-
49
-
50
-
51
-
52
-
53
-
54
-
55
-
56
-
57
-
58
-
59
-
60
-
61
-
62
-
63
-
64
-
65
-
66
-
67
-
68
-
69
-
70
-
71
-
72
-
73
-
74
-
75
-
76
-
77
-
78
-
79
-
80
-
81
-
82
-
83
-
84
-
85
-
86
-
87
-
88
-
89
-
90
-
91
-
92
-
93
-
94
-
95
-
96
-
97
-
 98
98 -
 99
99 -
 100
100 -
 101
101 -
 102
102 -
 103
103 -
 104
104 -
 105
105 -
 106
106 -
 107
107 -
 108
108 -
 109
109 -
 110
110 -
 111
111 -
 112
112 -
 113
113 -
 114
114 -
 115
115 -
 116
116 -
 117
117 -
 118
118 -
119
-
120
-
121
-
122
-
123
-
124
-
125
-
126
-
127
-
128
-
129
 |
 |

SEARS HOLDINGS CORPORATION
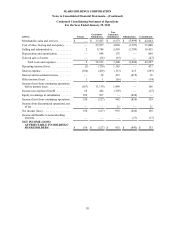
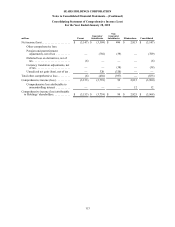
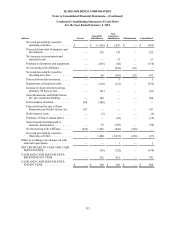
Notes to Consolidated Financial Statements—(Continued)
108
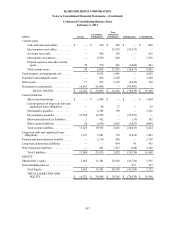
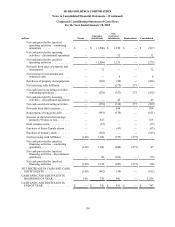
Condensed Consolidating Balance Sheet
January 28, 2012
millions Parent Guarantor
Subsidiaries
Non-
Guarantor
Subsidiaries Eliminations Consolidated
Current assets
Cash and cash equivalents . . . . . . . . . $ — $ 336 $ 411 $ — $ 747
Intercompany receivables. . . . . . . . . . — — 25,129 (25,129) —
Accounts receivable . . . . . . . . . . . . . . — 486 209 — 695
Merchandise inventories. . . . . . . . . . . — 7,590 817 — 8,407
Prepaid expenses and other current
assets . . . . . . . . . . . . . . . . . . . . . . . . 42 760 458 (865) 395
Total current assets . . . . . . . . . . . . . . . 42 9,172 27,024 (25,994) 10,244
Total property and equipment, net. . . . . . . — 4,837 1,740 — 6,577
Goodwill and intangible assets . . . . . . . . . — 1,178 2,600 — 3,778
Other assets . . . . . . . . . . . . . . . . . . . . . . . . 22 190 2,589 (2,019) 782
Investment in subsidiaries . . . . . . . . . . . . . 17,332 25,648 — (42,980) —
TOTAL ASSETS. . . . . . . . . . . . . $ 17,396 $ 41,025 $ 33,953 $ (70,993) $ 21,381
Current liabilities
Short-term borrowings . . . . . . . . . . . . $ — $ 1,175 $ — $ — $ 1,175
Current portion of long-term debt and
capitalized lease obligations . . . . . . — 213 17 — 230
Merchandise payables. . . . . . . . . . . . . — 2,476 436 — 2,912
Intercompany payables. . . . . . . . . . . . 11,844 13,285 — (25,129) —
Short-term deferred tax liabilities. . . . 5 541 — (30) 516
Other current liabilities. . . . . . . . . . . . 29 2,856 2,329 (835) 4,379
Total current liabilities . . . . . . . . . . . . 11,878 20,546 2,782 (25,994) 9,212
Long-term debt and capitalized lease
obligations . . . . . . . . . . . . . . . . . . . . . . . 1,237 2,396 240 (1,785) 2,088
Pension and postretirement benefits . . . . . — 2,283 455 — 2,738
Long-term deferred tax liabilities . . . . . . . — 5 817 (6) 816
Other long-term liabilities . . . . . . . . . . . . . — 900 1,514 (228) 2,186
Total Liabilities. . . . . . . . . . . . . . . . . . 13,115 26,130 5,808 (28,013) 17,040
EQUITY
Shareholder’s equity . . . . . . . . . . . . . . . . . 4,281 14,895 28,145 (43,040) 4,281
Noncontrolling interest . . . . . . . . . . . . . . . — — — 60 60
Total Equity . . . . . . . . . . . . . . . . . . . . 4,281 14,895 28,145 (42,980) 4,341
TOTAL LIABILITIES AND
EQUITY . . . . . . . . . . . . . . . . . . . . . $ 17,396 $ 41,025 $ 33,953 $ (70,993) $ 21,381