Samsung 2013 Annual Report Download - page 54
Download and view the complete annual report
Please find page 54 of the 2013 Samsung annual report below. You can navigate through the pages in the report by either clicking on the pages listed below, or by using the keyword search tool below to find specific information within the annual report.-
 1
1 -
2
-
3
-
4
-
5
-
6
-
7
-
8
-
9
-
10
-
11
-
12
-
13
-
14
-
15
-
16
-
17
-
18
-
19
-
20
-
21
-
22
-
23
-
24
-
25
-
26
-
27
-
28
-
29
-
30
-
31
-
32
-
33
-
34
-
35
-
36
-
37
-
38
-
39
-
40
-
41
-
42
-
43
-
 44
44 -
 45
45 -
 46
46 -
 47
47 -
 48
48 -
 49
49 -
 50
50 -
 51
51 -
 52
52 -
 53
53 -
 54
54 -
 55
55 -
 56
56 -
 57
57 -
 58
58
 |
 |
104 105
2013 SAMSUNG ELECTRONICS ANNUAL REPORT
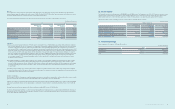
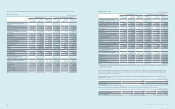
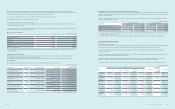
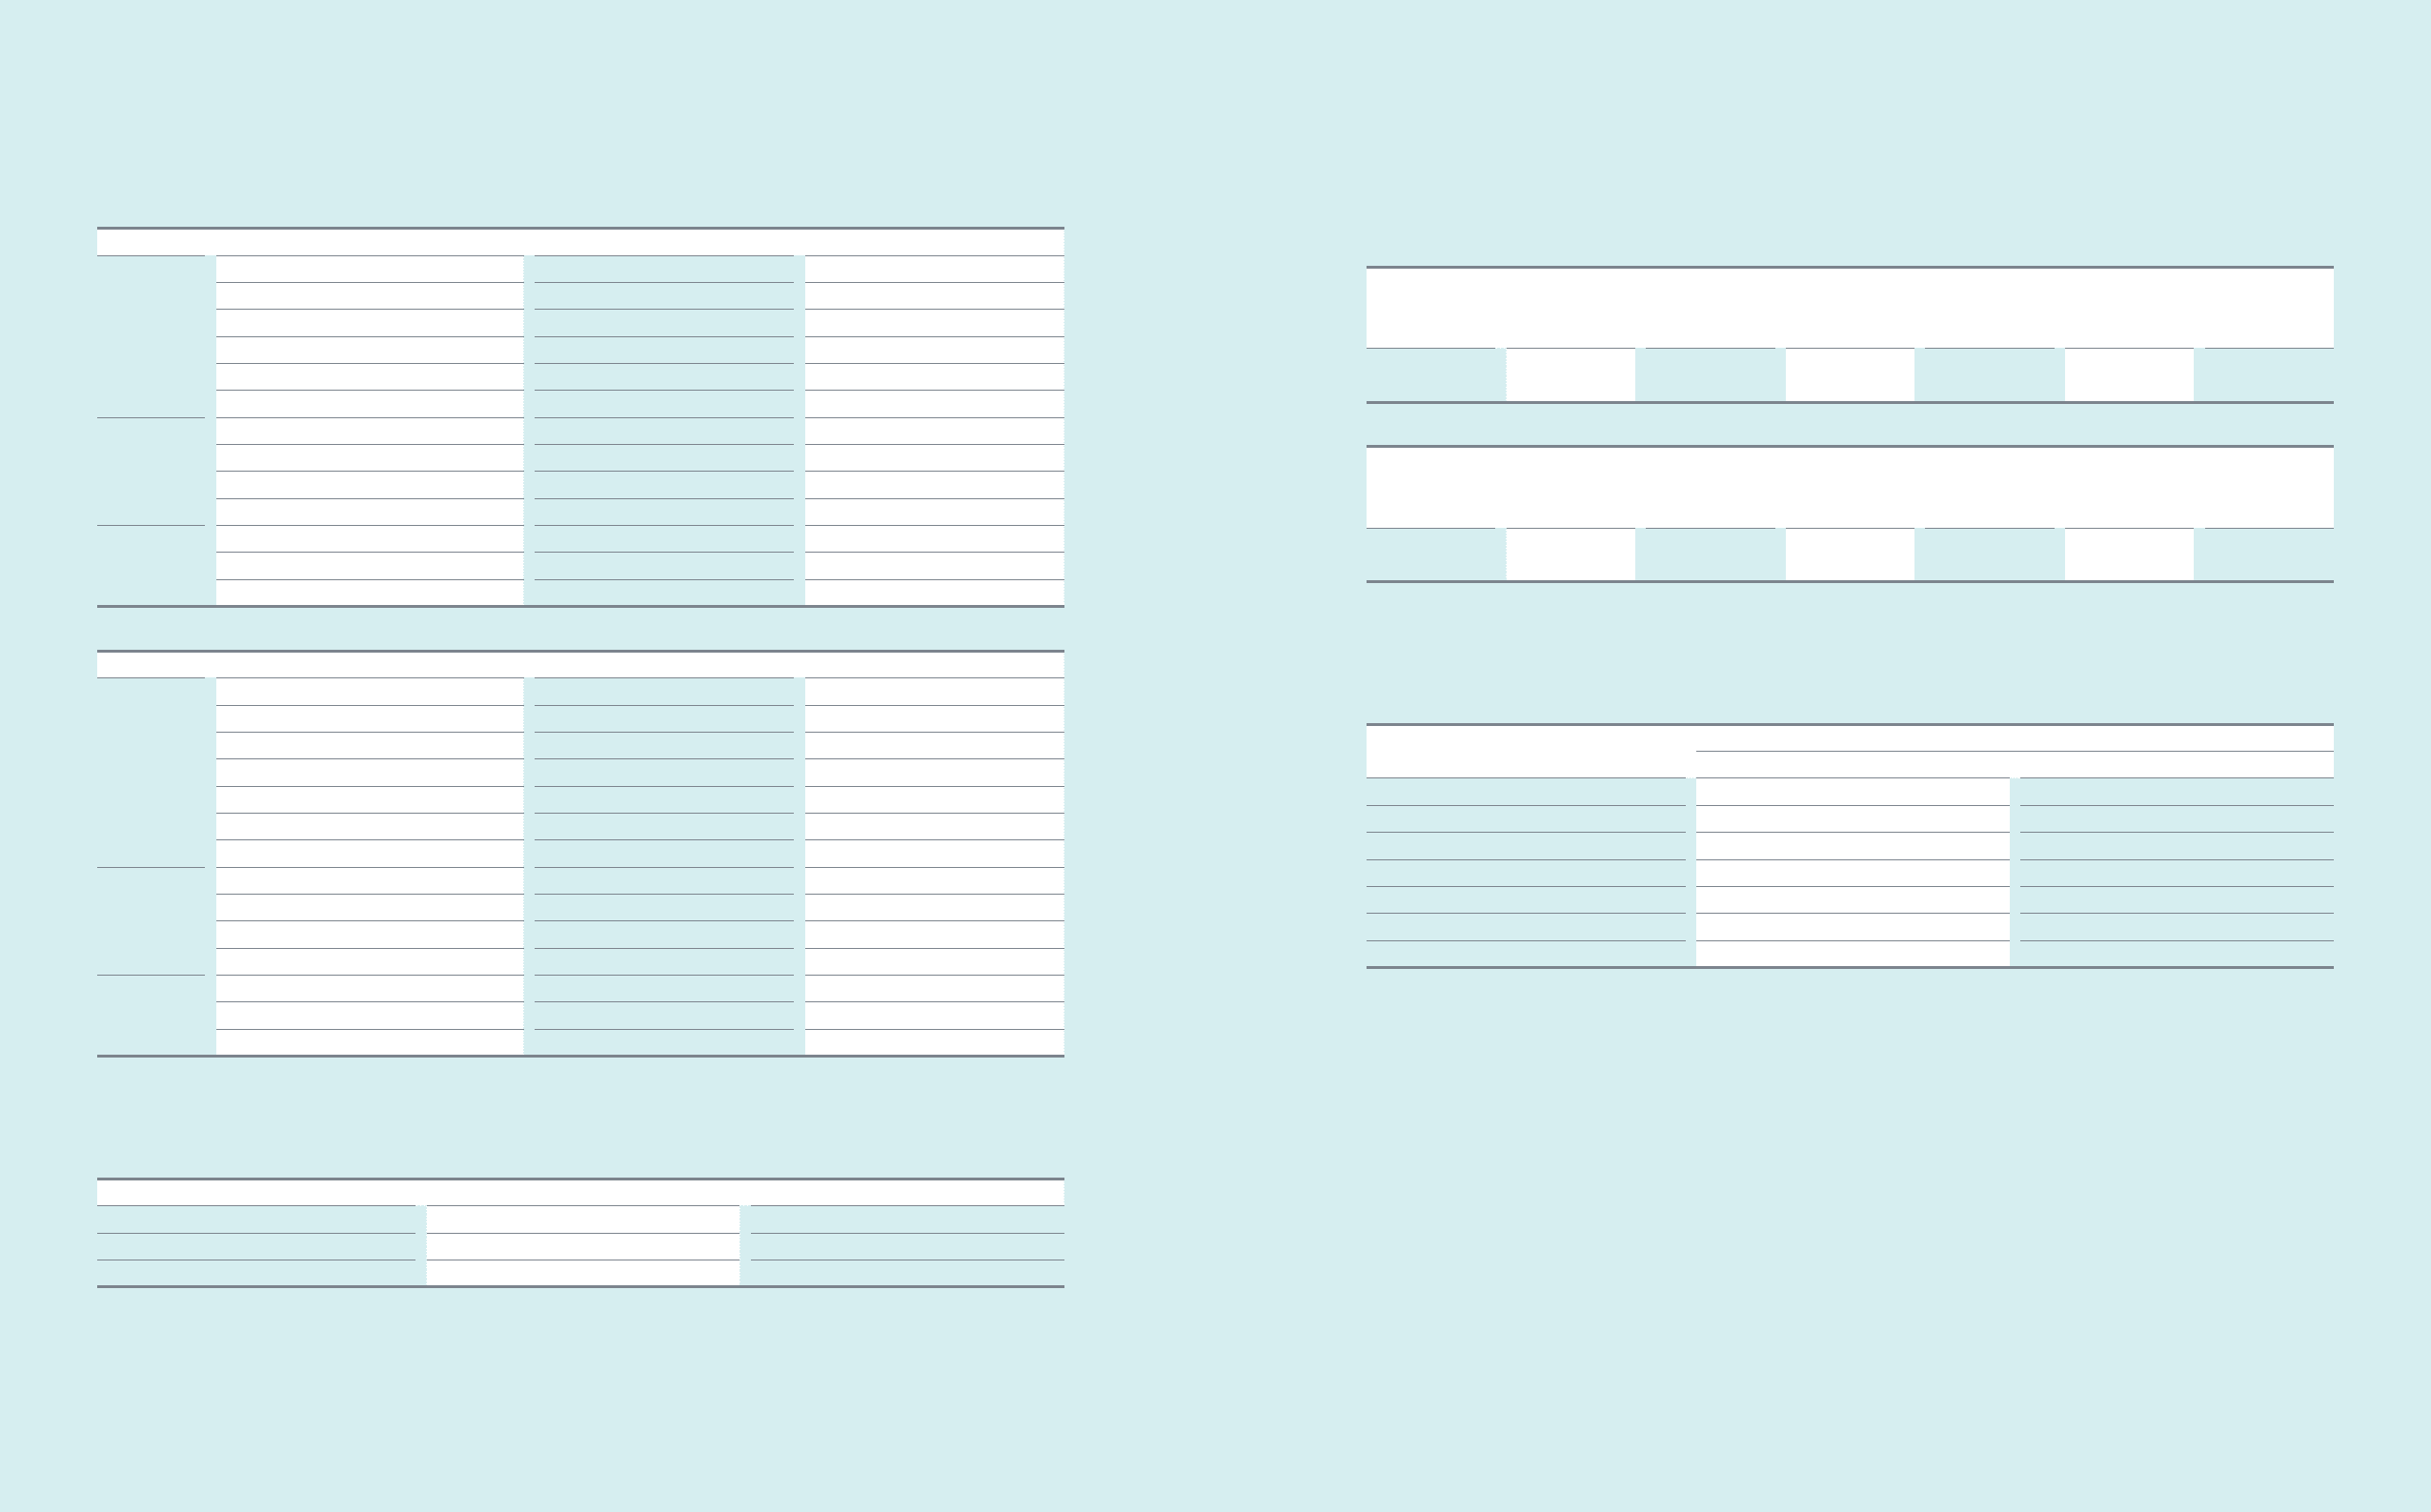
(B) Balances of receivables and payables
Year-end balances of receivables and payables arising from sales and purchases of goods and services as of December 31, 2013 and 2012, are as follows:
(In millions of Korean won)
2013 Name of Company Receivables, etc. Payables, etc.
Associates
Samsung SDS ₩11,319 ₩479,417
Samsung Electro-Mechanics 5,972 168,494
Samsung SDI 4,863 39,207
Samsung Techwin 1,879 44,286
Others 65,714 477,446
Total (associates) 89,747 1,208,850
Joint ventures
Samsung Corning Precision Materials 3,514 266,400
Siltronic Samsung Wafer - 1,454
Others 325
Total (joint ventures) 3,517 267,879
Other related
parties
Samsung Everland 188,982 282,777
Others 24,494 25,402
Total (other related parties) 213,476 308,179
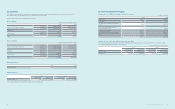
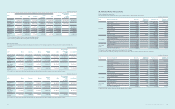
(In millions of Korean won)
2012 Name of Company Receivables, etc. Payables, etc.
Associates
Samsung SDS ₩13,651 ₩384,590
Samsung Electro-Mechanics 9,823 160,804
Samsung SDI 6,285 55,784
Samsung SNS 9,310 49,044
Samsung Techwin 1,859 18,167
Others 44,773 286,960
Total (associates) 85,701 955,349
Joint ventures
Samsung Corning Precision Materials 560 380,904
Siltronic Samsung Wafer - 20,595
Others 318 7,386
Total (joint ventures) 878 408,885
Other related
parties
Samsung Everland 166,828 178,049
Others 23,012 1,597
Total (other related parties) 189,840 179,646
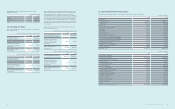
(C) Key management compensation
Key management includes directors (executive and non-executive) and members of the Executive Committee. The compensation paid or payable for employee
services for the years ended December 31, 2013 and 2012, consists of:
(In millions of Korean won)
2013 2012
Salaries and other short-term employee benets ₩23,906 ₩10,062
Termination benets 763 530
Other long-term benets 7,402 5,865
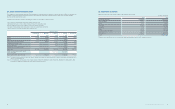
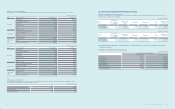
35. Information about Non-Controlling Interests
(A) Changes in accumulated non-controlling interests
The prot or loss allocated to non-controlling interests and accumulated non-controlling interests of subsidiaries that are material to the Company for the years
ended December 31, 2013 and 2012, is as follows:
(In millions of Korean won)
2013
Percentage of
Non-Controlling
Interests
Balance as of
January 1 Net Income Dividends Others Balance as of
December 31
Samsung Display
and its subsidiaries 15.2% 4,061,948 433,700 (1,553) 610,030 5,104,125
(In millions of Korean won)
2012
Percentage of
Non-Controlling
Interests
Balance as of
January 1 Net Income Dividends Others Balance as of
December 31
Samsung Display
and its subsidiaries 15.2% - 325,405 - 3,736,543 4,061,948
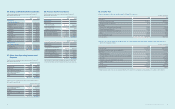
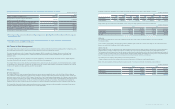
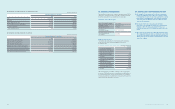
(B) The summarized nancial information for each subsidiary with non-controlling interests that are material to the Company before intercompany
eliminations is as follows:
(1) Summarized consolidated statements of nancial position
(In millions of Korean won)
Samsung Display and its subsidiaries
December 31, 2013 December 31, 2012
Current assets 14,473,616 11,605,285
Non-current assets 23,454,045 23,338,931
Current liabilities 6,115,203 6,328,757
Non-current liabilities 914,398 2,627,547
Equity attributable to: 30,898,060 25,987,912
Owners of the parent 30,434,116 25,840,634
Non-controlling interests 463,944 147,278