Samsung 2013 Annual Report Download - page 37
Download and view the complete annual report
Please find page 37 of the 2013 Samsung annual report below. You can navigate through the pages in the report by either clicking on the pages listed below, or by using the keyword search tool below to find specific information within the annual report.-
 1
1 -
2
-
3
-
4
-
5
-
6
-
7
-
8
-
9
-
10
-
11
-
12
-
13
-
14
-
15
-
16
-
17
-
18
-
19
-
20
-
21
-
22
-
23
-
24
-
25
-
26
-
 27
27 -
 28
28 -
 29
29 -
 30
30 -
 31
31 -
 32
32 -
 33
33 -
 34
34 -
 35
35 -
 36
36 -
 37
37 -
 38
38 -
 39
39 -
 40
40 -
 41
41 -
 42
42 -
 43
43 -
 44
44 -
 45
45 -
 46
46 -
 47
47 -
48
-
49
-
50
-
51
-
52
-
53
-
54
-
55
-
56
-
57
-
58
 |
 |

70 71
2013 SAMSUNG ELECTRONICS ANNUAL REPORT
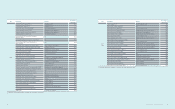
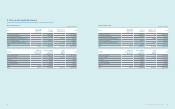
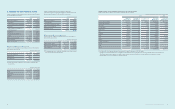
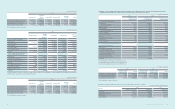
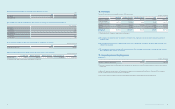
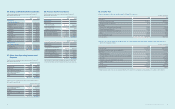
11. Inventories
Inventories as of December 31, 2013 and 2012, are as follows:
(In millions of Korean won)
2013 2012
Gross Amount Valuation
Allowance Book Value Gross Amount Valuation
Allowance Book Value
Finished goods ₩7,597,391 ₩(168,041) ₩7,429,350 ₩7,003,826 ₩(166,576) ₩6,837,250
Work in process 4,466,028 (395,762) 4,070,266 3,623,572 (392,996) 3,230,576
Raw materials and supplies 6,960,985 (151,873) 6,809,112 5,239,262 (157,866) 5,081,396
Materials in transit 826,140 - 826,140 2,598,191 - 2,598,191
₩19,850,544 ₩(715,676) ₩19,134,868 ₩18,464,851 ₩(717,438) ₩17,747,413
The cost of inventories recognized as expense and included in ‘cost of sales’ amounts to ₩136,755,644 million (2012: ₩125,746,083 million).
Inventory valuation loss of ₩435,607 million was recognized in 2013 (2012: ₩367,279 million).
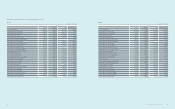
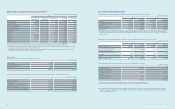
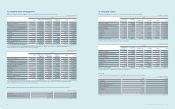
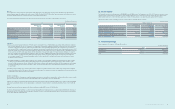
12. Investments in Associates and Joint Ventures
(A) Changes in investments in associates and joint ventures for the years ended December 31, 2013 and 2012, are as follows:
(In millions of Korean won)
2013 2012
Balance as of January 1 ₩8,785,489 ₩9,204,169
Acquisition 181,307 279,022
Disposal (240) (21,891)
Share of prot 504,063 986,611
Others (*) (3,048,327) (1,662,422)
Balance as of December 31 ₩6,422,292 ₩8,785,489
(*) Others consist of dividends, business combination, and effects of changes in foreign exchange rates, etc.
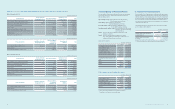
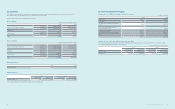
(B) Major investments in associates and joint ventures as of December 31, 2013, are as follows:
(1) Investments in associates
Investee Nature of Relationship with Associate Percentage of
Ownership (*)(%)
Principal Business
Location
Samsung Card Business alliance 37.5 Korea
Samsung Electro-Mechanics Manufacture and supply electronic components
including passive component, circuit board, and module 23.7 Korea
Samsung SDI Manufacture and supply electronic devices including PDP
and secondary (rechargeable) batteries 20.4 Korea
Samsung SDS Provide IT services including computer programming,
system integration and management 22.6 Korea
Samsung Techwin Manufacture and supply engine and precision machines 25.5 Korea
(*) The ownership represents the Company’s ownership of common stock in each entity.
2) Investments in joint ventures
Investee Nature of Relationship with Joint Venture Percentage of
Ownership (*)(%)
Principal Business
Location
Samsung Corning Advanced Glass Manufacture and supply other industrial glass devices 50.0 Korea
(*) The ownership represents the Company’s ownership of common stock in each entity.
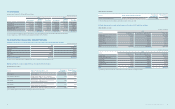
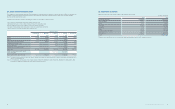
(C) Details of investments in associates and joint ventures as of December 31, 2013 and 2012, are as follows:
(1) Investments in associates
(In millions of Korean won)
Investee
2013
Acquisition cost Net asset value of equity shares (*) Book value
Samsung Card ₩1,538,540 ₩2,322,897 ₩2,340,009
Samsung Electro-Mechanics 359,237 951,693 954,496
Samsung SDI 423,722 1,451,770 1,175,204
Samsung SDS 147,963 858,671 879,956
Samsung Techwin 174,531 433,624 402,745
Others 582,646 375,959 548,553
Total ₩3,226,639 ₩6,394,614 ₩6,300,963
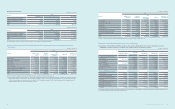
(In millions of Korean won)
Investee
2012
Acquisition cost Net asset value of equity shares (*) Book value
Samsung Card ₩1,538,540 ₩2,221,201 ₩2,238,073
Samsung Electro-Mechanics 359,237 887,933 890,460
Samsung SDI 423,722 1,450,811 1,174,183
Samsung SDS 17,967 689,874 701,808
Samsung Techwin 174,531 401,146 360,739
Others 461,599 513,580 457,016
Total ₩2,975,596 ₩6,164,545 ₩5,822,279
(*) Company’s portion of net asset value of associates based on the Company’s ownership percentage.