Samsung 2013 Annual Report Download - page 53
Download and view the complete annual report
Please find page 53 of the 2013 Samsung annual report below. You can navigate through the pages in the report by either clicking on the pages listed below, or by using the keyword search tool below to find specific information within the annual report.-
 1
1 -
2
-
3
-
4
-
5
-
6
-
7
-
8
-
9
-
10
-
11
-
12
-
13
-
14
-
15
-
16
-
17
-
18
-
19
-
20
-
21
-
22
-
23
-
24
-
25
-
26
-
27
-
28
-
29
-
30
-
31
-
32
-
33
-
34
-
35
-
36
-
37
-
38
-
39
-
40
-
41
-
42
-
 43
43 -
 44
44 -
 45
45 -
 46
46 -
 47
47 -
 48
48 -
 49
49 -
 50
50 -
 51
51 -
 52
52 -
 53
53 -
 54
54 -
 55
55 -
 56
56 -
 57
57 -
 58
58
 |
 |
102 103
2013 SAMSUNG ELECTRONICS ANNUAL REPORT
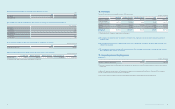
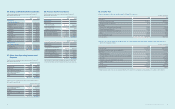
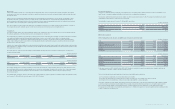
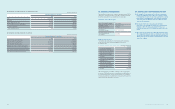
(In millions of Korean won)
2012
DS
Total (*1)
Intercompany
elimination
within
the group
Consolidated
CE IM Total (*1) Semi
conductor DP
Total segment
Revenue 117,897,781 224,920,171 136,724,256 66,976,623 69,359,762 479,499,910 (278,396,297) 201,103,613
Intercompany
revenue (66,792,679) (119,075,488) (68,436,962) (32,090,017) (36,360,406) (278,396,297) 278,396,297 -
Net revenue
(*2) 51,105,102 105,844,683 68,287,294 34,886,606 32,999,356 201,103,613 - 201,103,613
Depreciation 578,686 484,231 13,354,303 9,087,880 4,179,088 14,835,046 - 14,835,046
Amortization 76,380 182,730 274,568 186,497 77,047 786,970 - 786,970
Operating
prot 2,324,036 19,418,235 7,416,325 4,173,730 3,214,750 29,049,338 - 29,049,338
(*1) The total amount includes others not composing operating segments.
(*2) Net revenue by segment includes intersegment revenue by segment.
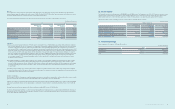
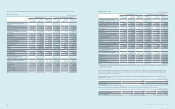
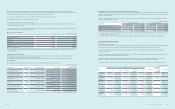
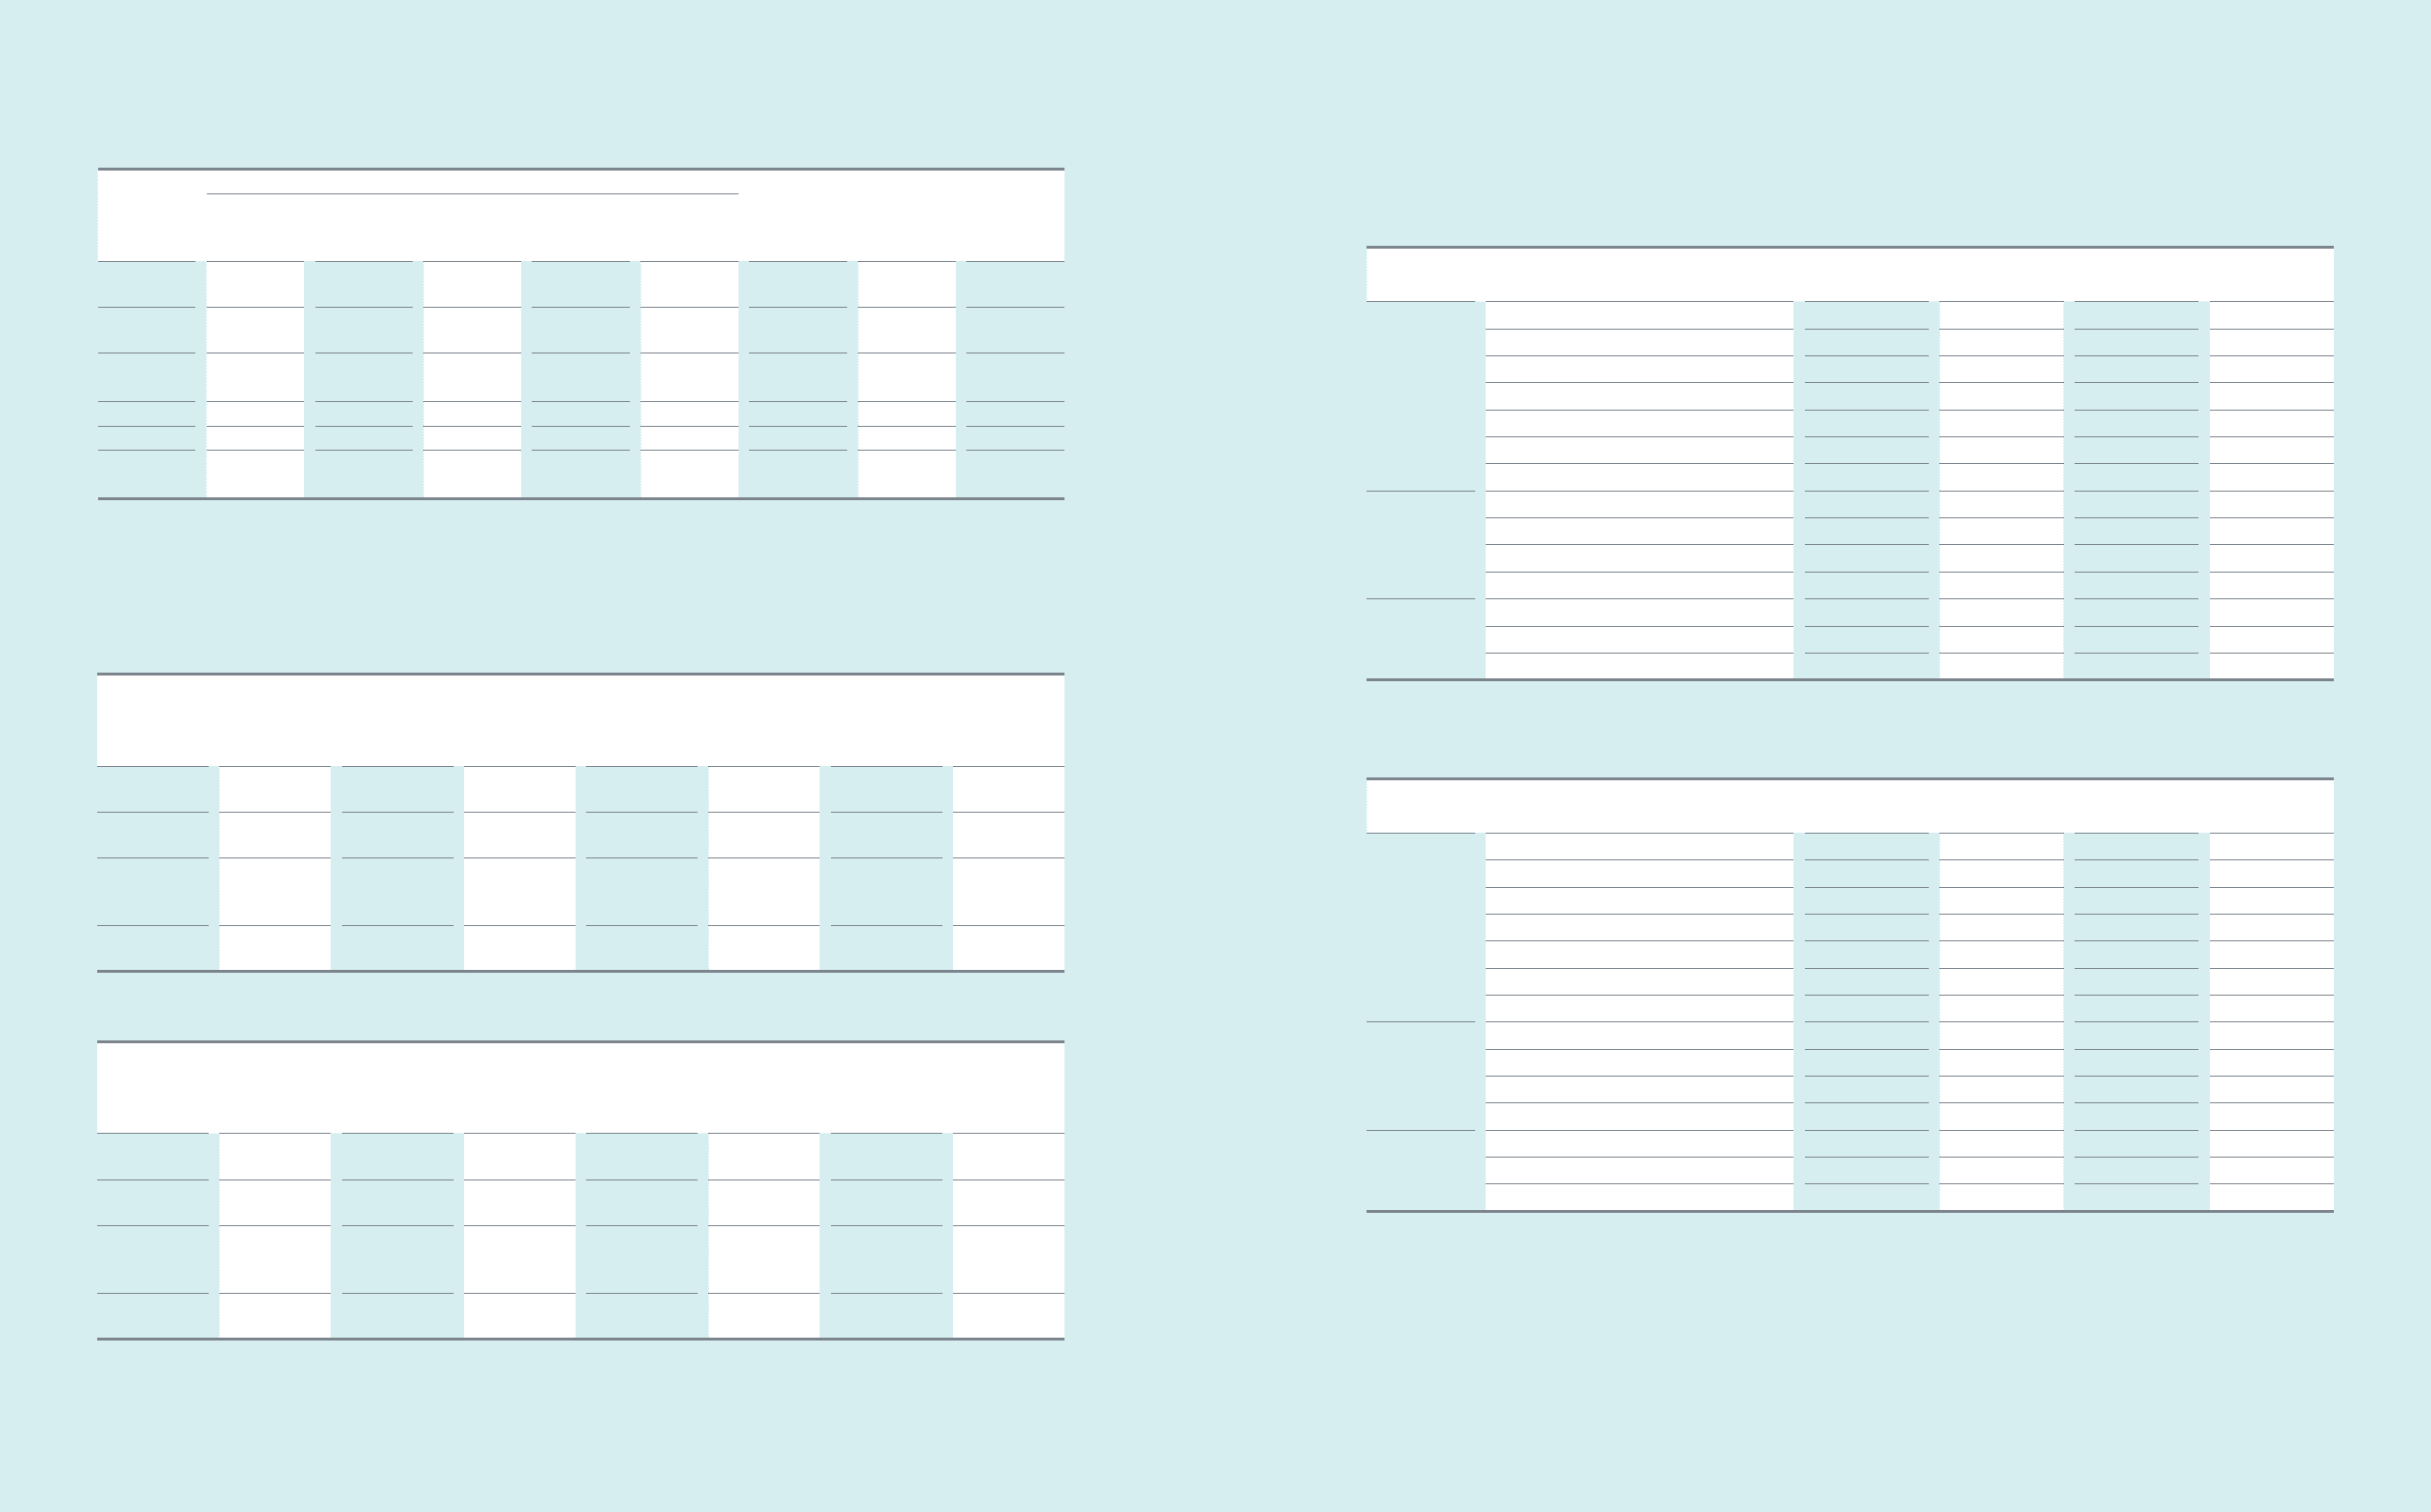
(B) Regional information
The regional segment information provided to the Management Committee for the reportable segments for the years ended 31 December 2013 and 2012,
is as follows:
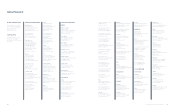
(In millions of Korean won)
2013 Korea America Europe Asia and
Africa China
Intercompany
elimination
within
the group
Consolidated
Total segment
revenue 193,645,486 94,703,877 79,416,987 76,409,011 114,020,817 (329,503,511) 228,692,667
Intercompany
revenue (170,862,177) (25,320,451) (26,738,602) (32,712,684) (73,869,597) 329,503,511 -
Revenue
from external
customers
22,783,309 69,383,426 52,678,385 43,696,327 40,151,220 - 228,692,667
Non-current
assets (*) 61,881,863 7,172,187 1,024,699 2,636,552 7,436,424 (674,737) 79,476,988
(*) The total of non-current assets other than nancial instruments, deferred tax assets, and investments in associates and joint ventures.
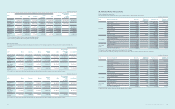
(In millions of Korean won)
2012 Korea America Europe Asia and
Africa China
Intercompany
elimination
within
the group
Consolidated
Total segment
revenue 179,434,349 81,440,718 75,448,403 57,246,033 85,930,407 (278,396,297) 201,103,613
Intercompany
revenue (150,254,258) (23,277,536) (25,927,742) (21,167,278) (57,769,483) 278,396,297 -
Revenue
from external
customers
29,180,091 58,163,182 49,520,661 36,078,755 28,160,924 - 201,103,613
Non-current
assets (*) 60,591,343 6,890,648 1,030,437 1,749,330 2,574,796 (622,106) 72,214,448
(*) The total of non-current assets other than nancial instruments, deferred tax assets, and investments in associates and joint ventures.
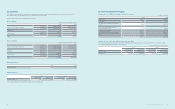
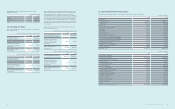
34. Related Party Transactions
(A) Sale and purchase transactions
Sales and purchases with related parties for the years ended December 31, 2013 and 2012, are as follows:
(In millions of Korean won)
2013 Name of Company (*1) Sales, etc. Disposal of
xed assets Purchase, etc. Purchase of
xed assets
Associates
Samsung SDS ₩35,166 ₩130,771 ₩1,673,999 ₩369,395
Samsung Electro-Mechanics 72,897 192 2,662,680 76
Samsung SDI 52,909 - 667,658 1,258
Samsung SNS (*2) 11,418 - 164,093 3,973
Samsung Techwin 15,582 - 84,074 68,949
Others 412,353 - 6,042,874 284,231
Total (associates) 600,325 130,963 11,295,378 727,882
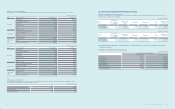
Joint ventures
Samsung Corning Precision Materials 9,931 - 1,758,317 145,324
Siltronic Samsung Wafer - - 195,795 -
Others 83 - 147 -
Total (joint ventures) 10,014 - 1,954,259 145,324
Other related
parties
Samsung Everland 12,690 - 543,162 487,107
Others 112,896 - 83,058 22,942
Total (other related parties) 125,586 - 626,220 510,049
(*1) Transactions with separate entities that are related parties of the Company.
(*2) Samsung SNS was acquired by Samsung SDS in 2013, and the above amounts relate to transactions prior to the acquisition.
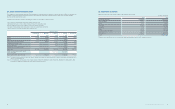
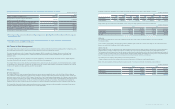
(In millions of Korean won)
2012 Name of Company (*) Sales, etc. Disposal of
xed assets Purchase, etc. Purchase of
xed assets
Associates
Samsung SDS ₩68,234 ₩202 ₩1,508,214 ₩365,482
Samsung Electro-Mechanics 163,086 104 2,229,786 -
Samsung SDI 117,020 1 874,972 183
Samsung SNS 15,697 - 227,165 208
Samsung Techwin 25,051 - 89,889 79,076
Others 417,228 35 4,303,946 31,689
Total (associates) 806,316 342 9,233,972 476,638
Joint ventures
Samsung Corning Precision Materials 20,185 14,660 2,517,028 -
Siltronic Samsung Wafer - - 255,665 -
Others 639 - 28,296 -
Total (joint ventures) 20,824 14,660 2,800,989 -
Other related
parties
Samsung Everland 8,363 281 398,621 319,459
Others 100,584 - 34,042 48
Total (other related parties) 108,947 281 432,663 319,507
(*) Transactions with separate entities that are related parties of the Company.