Samsung 2013 Annual Report Download - page 2
Download and view the complete annual report
Please find page 2 of the 2013 Samsung annual report below. You can navigate through the pages in the report by either clicking on the pages listed below, or by using the keyword search tool below to find specific information within the annual report.-
 1
1 -
 2
2 -
 3
3 -
 4
4 -
 5
5 -
 6
6 -
 7
7 -
 8
8 -
 9
9 -
 10
10 -
 11
11 -
 12
12 -
 13
13 -
14
-
15
-
16
-
17
-
18
-
19
-
20
-
21
-
22
-
23
-
24
-
25
-
26
-
27
-
28
-
29
-
30
-
31
-
32
-
33
-
34
-
35
-
36
-
37
-
38
-
39
-
40
-
41
-
42
-
43
-
44
-
45
-
46
-
47
-
48
-
49
-
50
-
51
-
52
-
53
-
54
-
55
-
56
-
57
-
58
 |
 |
By welcoming challenges of the new,
creativity that pushes the possible
and close and efcient collaboration,
Samsung Electronics leads
the astonishing evolution of
technology, producing positive
change for the world.
We continue to dream big about
forging new paths and ideas.
Focused on the excitement of
challenge, the anticipation of
creative discovery and the joys of
warm-hearted collaboration,
we are inspiring the future and
inventing new tomorrows.
Challenge,
Creativity,
Collaboration
2013 Financial Summary
Samsung Electronics and Consolidated Subsidiaries
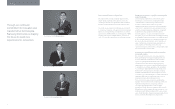
CEOs’ Message
About the Board
Business Overview
Global Citizenship
Financial Statements
Global Network
02
06
09
29
37
108
Contents
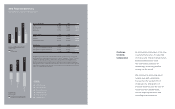
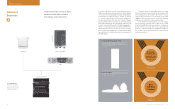
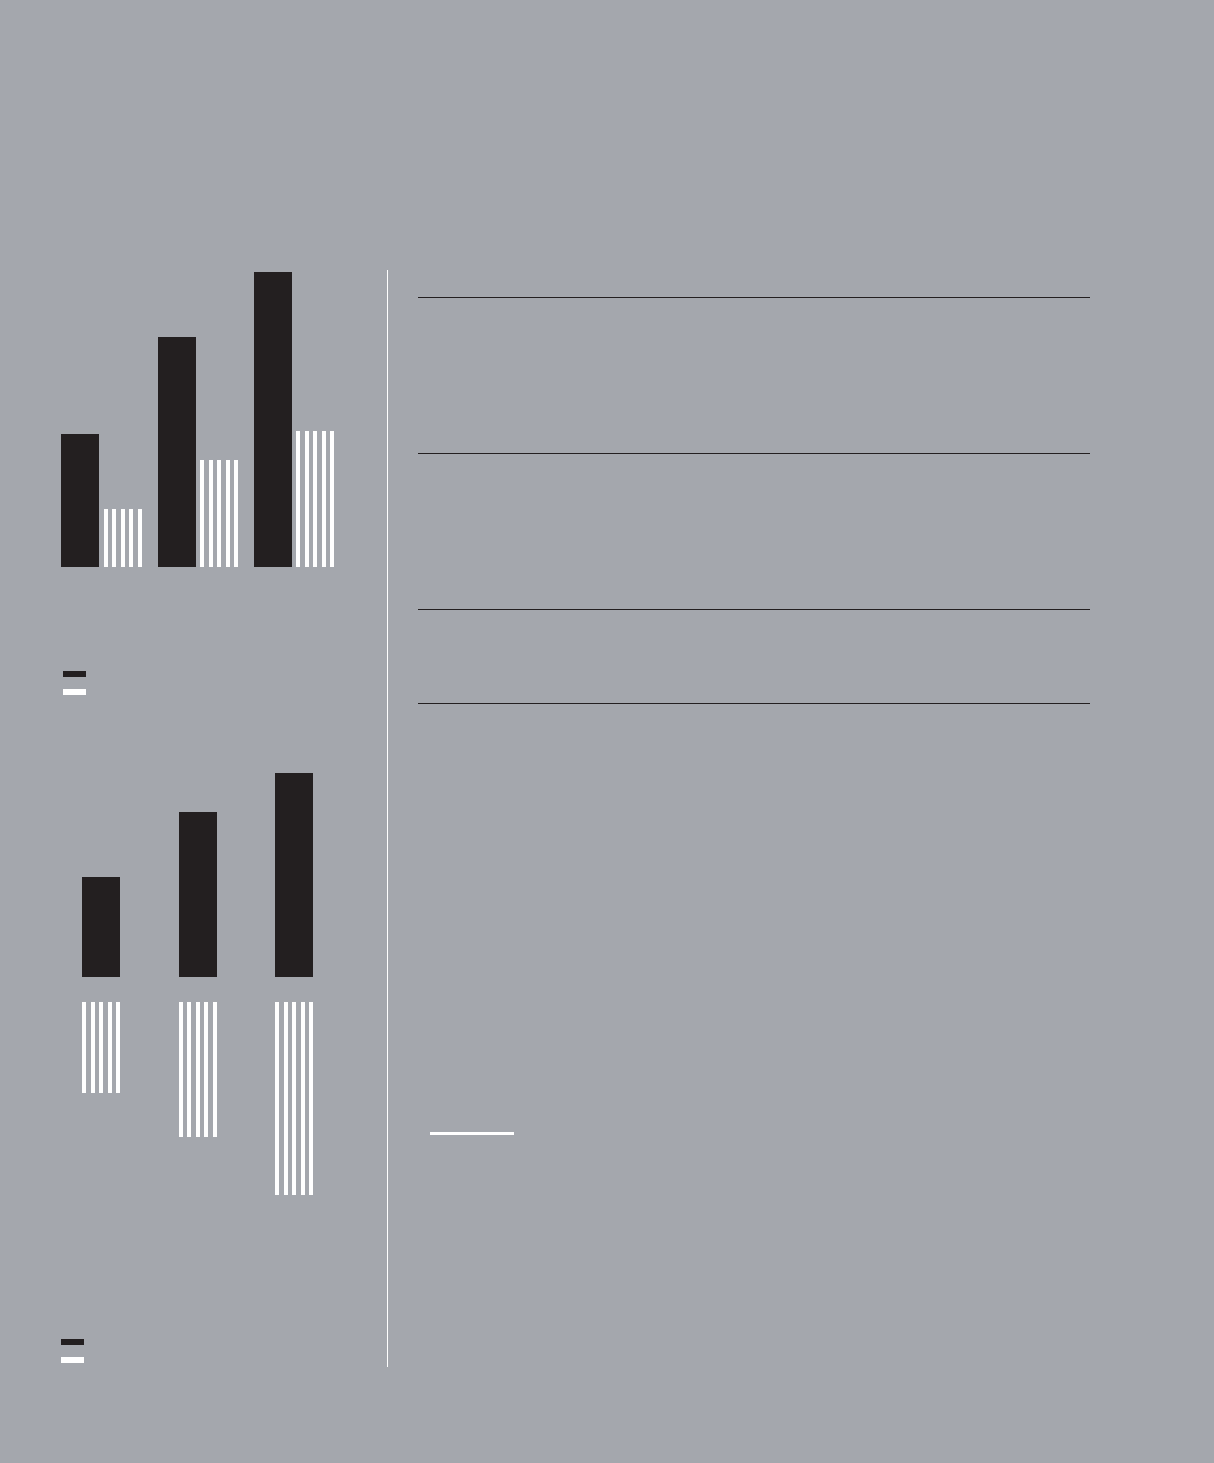
Sales and Operating Prot
(in billions of KRW)
Sales
Operating Prot
2011 2012 2013
15,644
29,049
36,785
201,104
228,693
165,002
Cash Flows
(in billions of KRW)
Cash Flows from Operating Activities
Cash Flows from Investing Activities
2011 2012 2013
(21,113)
(31,322)
(44,747)
22,918
37,973
46,707
Income Statements 2011 2012 2013
Sales 165,002 201,104 228,693
Operating Prot 15,644 29,049 36,785
Net Income 13,759 23,845 30,475
Balance Sheets 2011 2012 2013
Assets 155,800 181,072 214,075
Liabilities 54,487 59,591 64,059
Shareholders’ Equity 101,314 121,480 150,016
Cash Flows 2011 2012 2013
Cash Flows from Operating Activities 22,918 37,973 46,707
Cash Flows from Investing Activities (21,113) (31,322) (44,747)
Cash Flows from Financing Activities 3,110 (1,865) (4,137)
(in billions of KRW)
This annual report includes forward-looking statements that relate to future events and can be generally
identied by phrases containing words such as “believes,” “expects,” “anticipates,” “foresees,” “forecasts,”
“estimates” or other words or phrases of similar meaning. These forward-looking statements are not
guarantees of future performance and may involve known and unknown risks, uncertainties and other
factors that may affect our actual results, performance, achievements or nancial position, making them
materially different from the actual future results, performance, achievements or nancial position expressed
or implied by these forward-looking statements. Unless otherwise specied, all data presented in this report
is from our consolidated nancial statements.