Samsung 2013 Annual Report Download - page 40
Download and view the complete annual report
Please find page 40 of the 2013 Samsung annual report below. You can navigate through the pages in the report by either clicking on the pages listed below, or by using the keyword search tool below to find specific information within the annual report.-
 1
1 -
2
-
3
-
4
-
5
-
6
-
7
-
8
-
9
-
10
-
11
-
12
-
13
-
14
-
15
-
16
-
17
-
18
-
19
-
20
-
21
-
22
-
23
-
24
-
25
-
26
-
27
-
28
-
29
-
 30
30 -
 31
31 -
 32
32 -
 33
33 -
 34
34 -
 35
35 -
 36
36 -
 37
37 -
 38
38 -
 39
39 -
 40
40 -
 41
41 -
 42
42 -
 43
43 -
 44
44 -
 45
45 -
 46
46 -
 47
47 -
 48
48 -
 49
49 -
 50
50 -
51
-
52
-
53
-
54
-
55
-
56
-
57
-
58
 |
 |
76 77
2013 SAMSUNG ELECTRONICS ANNUAL REPORT
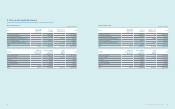
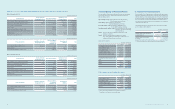
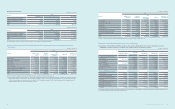
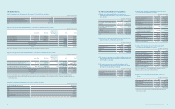
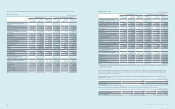
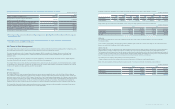
13. Property, Plant and Equipment
(A) Changes in property, plant and equipment for the years ended December 31, 2013 and 2012, are as follows:
(In millions of Korean won)
2013
Land Buildings and
Structures
Machinery and
Equipment
Construction
In Progress Others Total
Balance as of January 1 ₩7,152,141 ₩13,008,839 ₩38,046,176 ₩8,492,885 ₩1,784,702 ₩68,484,743
Acquisition cost 7,152,141 19,624,030 110,034,355 8,492,885 5,011,914 150,315,325
Accumulated depreciation and impairment - (6,615,191) (71,988,179) - (3,227,212) (81,830,582)
Acquisitions and capital expenditures (*1) 322,433 4,209,093 12,627,962 5,362,760 1,237,317 23,759,565
Business combinations - 31 877 - 144 1,052
Depreciation - (1,146,000) (13,473,515) - (850,497) (15,470,012)
Sales/disposals (29,572) (30,850) (320,296) (50,930) (60,143) (491,791)
Impairment - (78) (145,263) - (175) (145,516)
Others (*2) (15,715) (325,971) (237,463) 35,457 (97,961) (641,653)
Balance as of December 31 ₩7,429,287 ₩15,715,064 ₩36,498,478 ₩13,840,172 ₩2,013,387 ₩75,496,388
Acquisition cost 7,429,287 23,375,035 118,621,699 13,840,172 5,518,351 168,784,544
Accumulated depreciation and impairment - (7,659,971) (82,123,221) - (3,504,964) (93,288,156)
(*1) The capitalized borrowing costs are ₩52,039 million and the interest rate used to calculate the borrowing costs eligible for capitalization is 1.73%.
(*2) Others include effects of changes in foreign currency exchange rates.
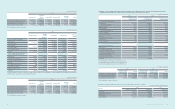
(In millions of Korean won)
2012
Land Buildings and
Structures
Machinery and
Equipment
Construction
In Progress Others Total
Balance as of January 1 ₩7,214,734 ₩12,778,760 ₩33,453,220 ₩6,982,473 ₩1,614,764 ₩62,043,951
Acquisition cost 7,214,734 18,472,852 96,618,176 6,982,473 4,683,845 133,972,080
Accumulated depreciation and impairment - (5,694,092) (63,164,956) - (3,069,081) (71,928,129)
Acquisitions and capital expenditures (*1) 54,960 1,681,106 18,302,895 1,854,111 956,723 22,849,795
Business combinations - - 654,490 21,612 29,007 705,109
Depreciation - (1,121,614) (12,895,133) - (818,299) (14,835,046)
Sales/disposals (76,724) (100,854) (604,989) (22,213) (114,292) (919,072)
Impairment - (3,992) (211,299) - (34) (215,325)
Others (*2) (40,829) (224,567) (653,008) (343,098) 116,833 (1,144,669)
Balance as of December 31 ₩7,152,141 ₩13,008,839 ₩38,046,176 ₩8,492,885 ₩1,784,702 ₩68,484,743
Acquisition cost 7,152,141 19,624,030 110,034,355 8,492,885 5,011,914 150,315,325
Accumulated depreciation and impairment - (6,615,191) (71,988,179) - (3,227,212) (81,830,582)
(*1) The capitalized borrowing costs are ₩36,129 million and the interest rate used to calculate the borrowing costs eligible for capitalization is 2.50%.
(*2) Others include effects of changes in foreign currency exchange rates.
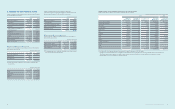
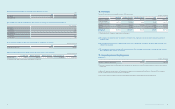
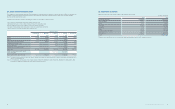
(B) Details of depreciation of property, plant and equipment by line item for the years ended December 31, 2013 and 2012, are as follows:
(In millions of Korean won)
2013 2012
Cost of sales ₩14,053,512 ₩13,666,700
Selling and administrative expenses, etc. 1,416,500 1,168,346
₩15,470,012 ₩14,835,046
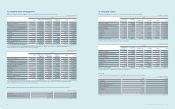
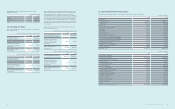
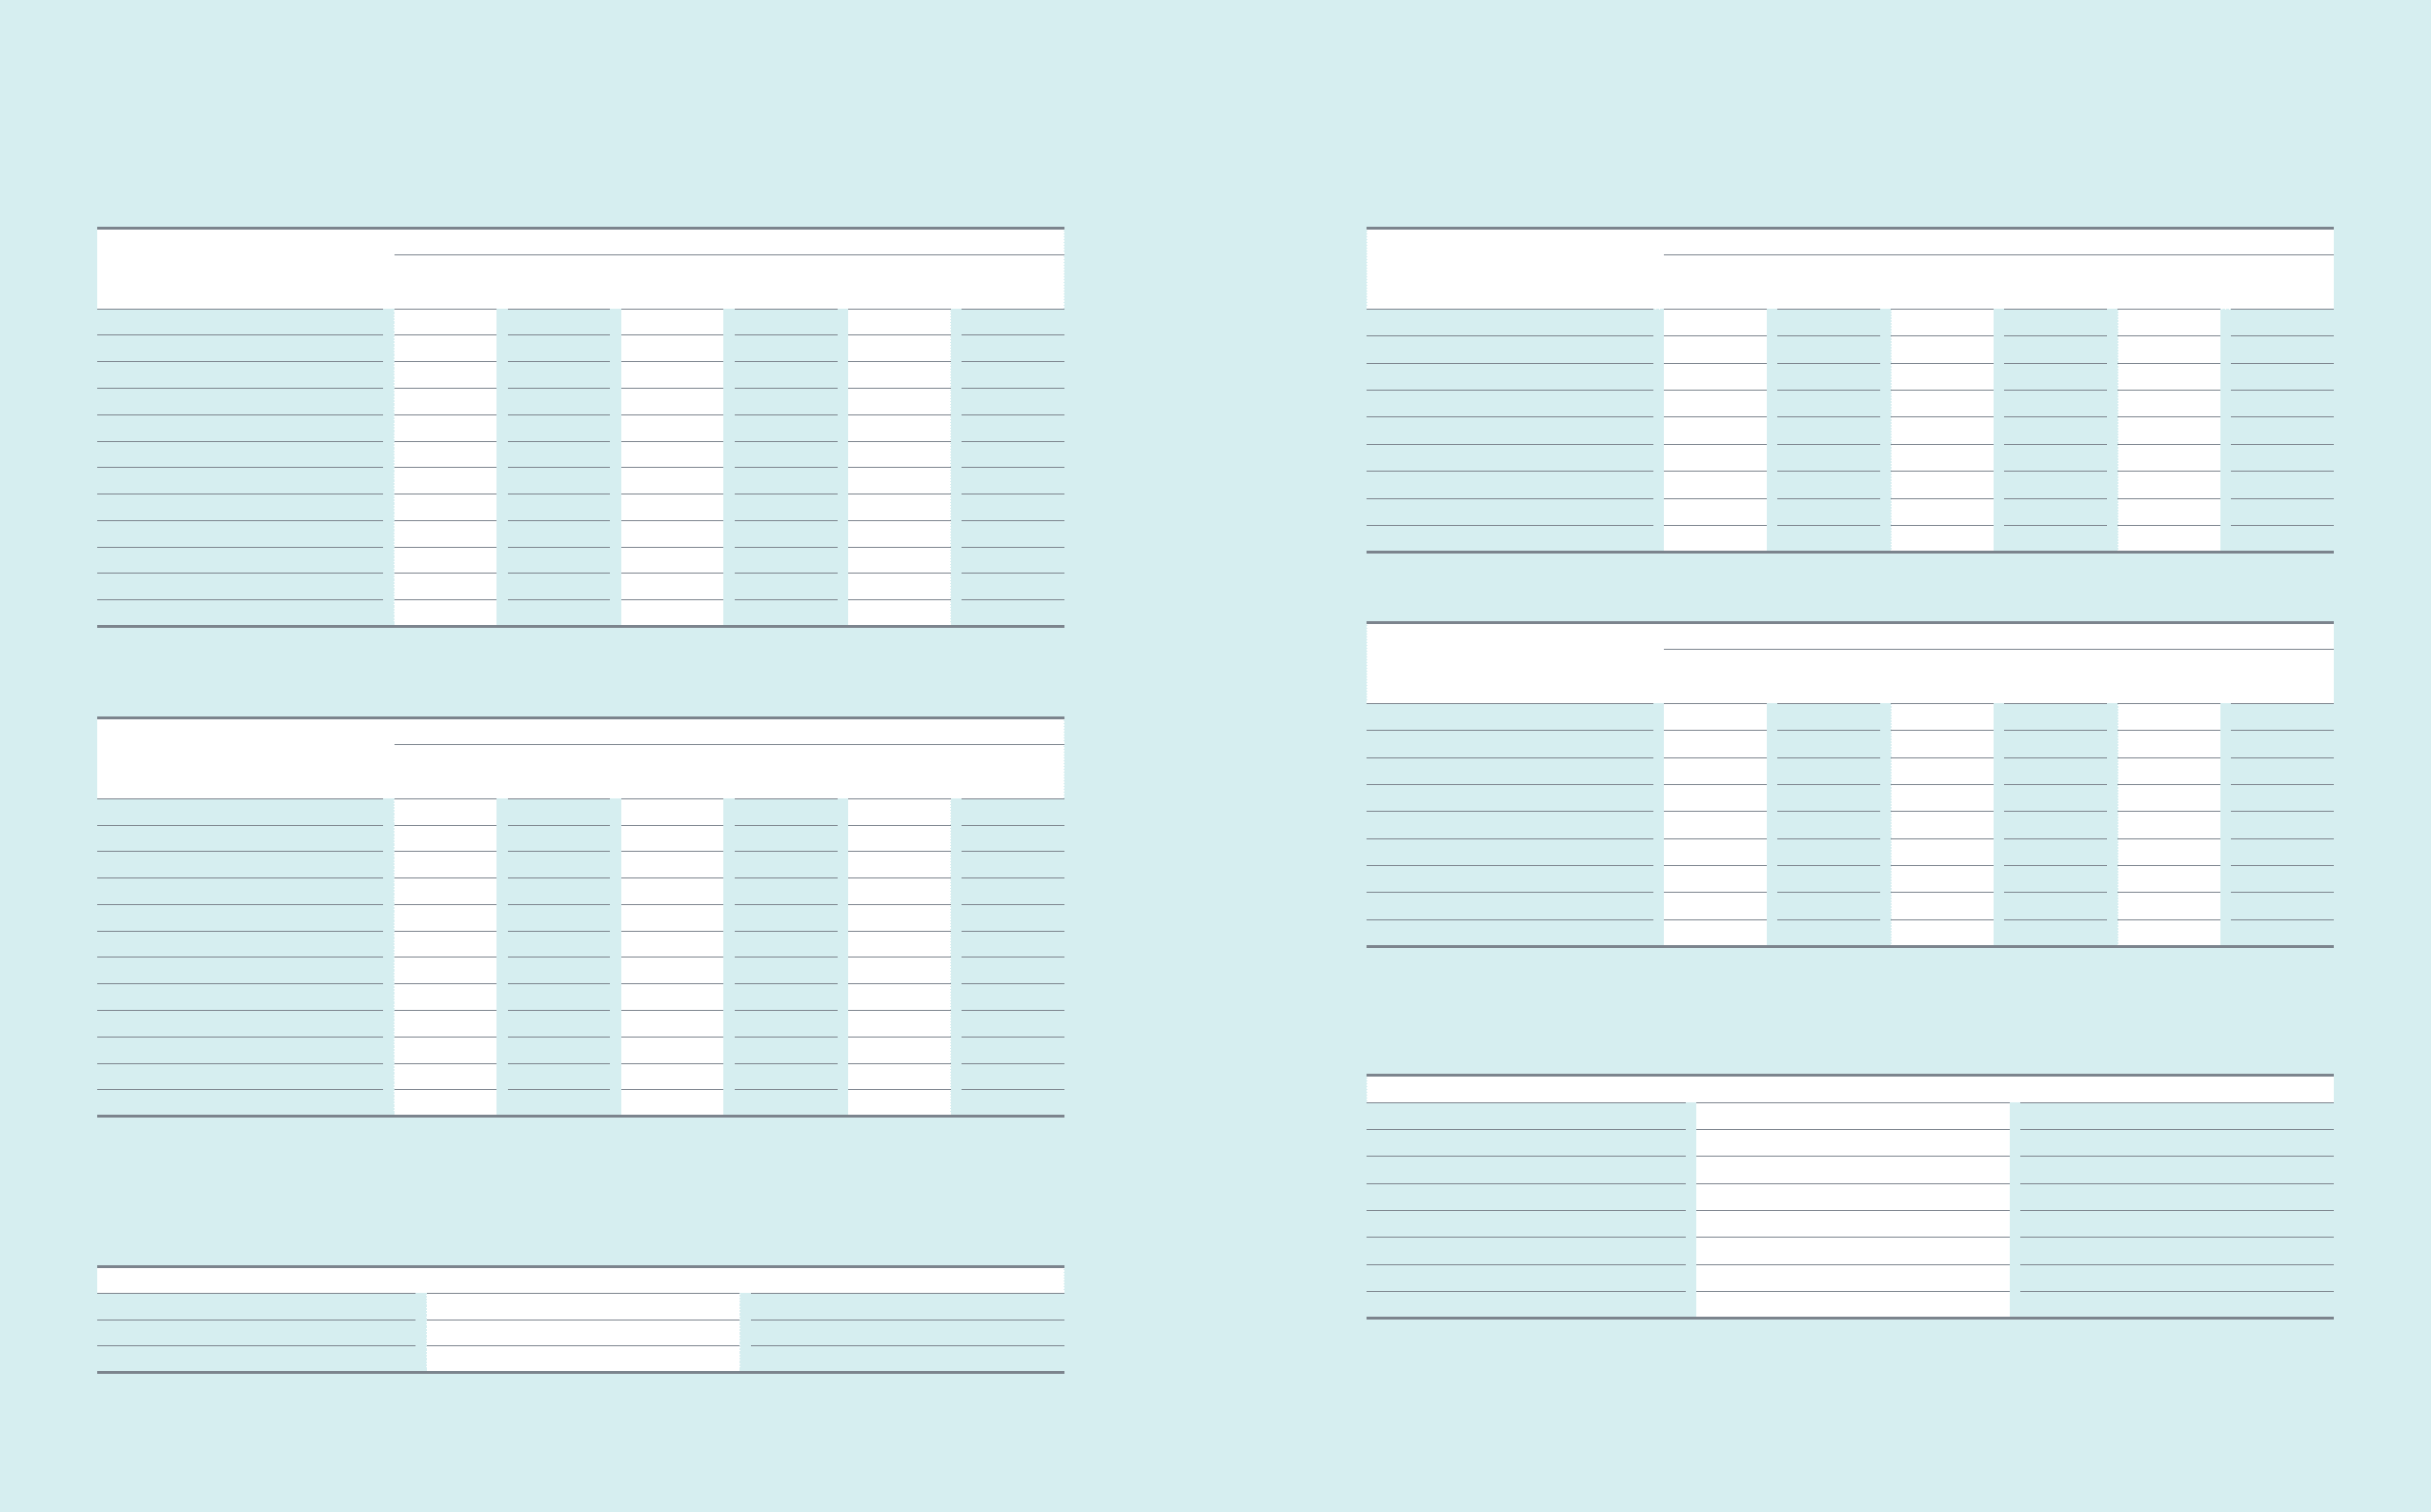
14. Intangible Assets
(A) Changes in intangible assets for the years ended December 31, 2013 and 2012, are as follows:
(In millions of Korean won)
2013
Intellectual
property rights
Capitalized
cost Membership Goodwill Others Total
Balance as of January 1 ₩1,186,033 ₩602,274 ₩170,843 ₩573,845 ₩1,196,710 ₩3,729,705
Internally generated (development costs) - 461,030 - - - 461,030
External acquisitions 284,392 - 7,203 - 182,118 473,713
Business combinations 49,046 - - 115,331 2,176 166,553
Amortization (200,452) (310,635) - - (464,314) (975,401)
Sales/disposals (44,633) - (572) (24,651) (4,125) (73,981)
Impairment (1,753) - - (99,643) (7,024) (108,420)
Others (*) (40,960) - 58 (4,348) 352,651 307,401
Balance as of December 31 ₩1,231,673 ₩752,669 ₩177,532 ₩560,534 ₩1,258,192 ₩3,980,600
(*) Others include effects of changes in foreign currency exchange rates.
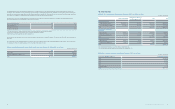
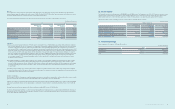
(In millions of Korean won)
2012
Intellectual
property rights
Capitalized
cost Membership Goodwill Others Total
Balance as of January 1 ₩983,802 ₩473,024 ₩197,957 ₩523,409 ₩1,177,044 ₩3,355,236
Internally generated (development costs) - 359,639 - - - 359,639
External acquisitions 227,538 - 9,520 - 64,832 301,890
Business combinations 163,164 - 3,670 259,961 71,917 498,712
Amortization (169,668) (229,186) - - (388,116) (786,970)
Sales/disposals (13,123) - (39,095) - (980) (53,198)
Impairment (124) (1,203) - (204,746) (10,717) (216,790)
Others (*) (5,556) - (1,209) (4,779) 282,730 271,186
Balance as of December 31 ₩1,186,033 ₩602,274 ₩170,843 ₩573,845 ₩1,196,710 ₩3,729,705
(*) Others include effects of changes in foreign currency exchange rates.
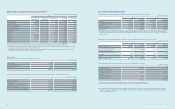
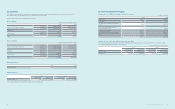
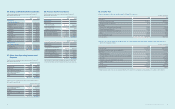
(B) Goodwill
Goodwill is allocated to cash-generating units at the end of the reporting period, and consists of the following:
(In millions of Korean won)
2013 2012
S. LSI business ₩109,120 ₩112,723
Memory business 74,418 74,995
Health Care Equipment business 199,758 89,258
Digital Imaging business - 82,599
LCD business 80,299 80,299
LED business 79,277 79,277
Others 17,662 54,694
Total ₩560,534 ₩573,845