Samsung 2013 Annual Report Download - page 45
Download and view the complete annual report
Please find page 45 of the 2013 Samsung annual report below. You can navigate through the pages in the report by either clicking on the pages listed below, or by using the keyword search tool below to find specific information within the annual report.-
 1
1 -
2
-
3
-
4
-
5
-
6
-
7
-
8
-
9
-
10
-
11
-
12
-
13
-
14
-
15
-
16
-
17
-
18
-
19
-
20
-
21
-
22
-
23
-
24
-
25
-
26
-
27
-
28
-
29
-
30
-
31
-
32
-
33
-
34
-
 35
35 -
 36
36 -
 37
37 -
 38
38 -
 39
39 -
 40
40 -
 41
41 -
 42
42 -
 43
43 -
 44
44 -
 45
45 -
 46
46 -
 47
47 -
 48
48 -
 49
49 -
 50
50 -
 51
51 -
 52
52 -
 53
53 -
 54
54 -
 55
55 -
56
-
57
-
58
 |
 |
86 87
2013 SAMSUNG ELECTRONICS ANNUAL REPORT
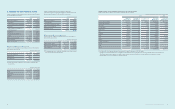
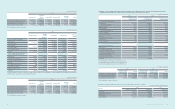
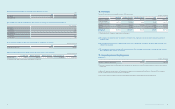
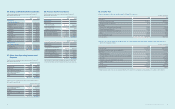
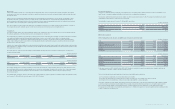
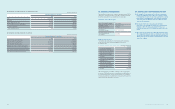
22. Dividends
The Company declared cash dividends to shareholders of common stock and preferred stock as interim dividends for the six-month periods ended June 30,
2013 and 2012, and as year-end dividends for the years ended December 31, 2013 and 2012.
Details of interim dividends and year-end dividends are as follows:
(A) Interim dividends
(In millions of Korean won and number of shares)
2013 2012
Number of shares eligible for dividends
Common stock 130,878,713 shares 130,759,755 shares
Preferred stock 19,853,734 shares 19,853,734 shares
Dividend rate 10% 10%
Dividend amount
Common stock ₩65,439 ₩65,380
Preferred stock 9,927 9,927
Total ₩75,366 ₩75,307
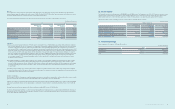
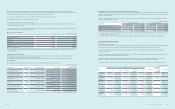
(B) Year-end dividends
(In millions of Korean won and number of shares)
2013 2012
Number of shares eligible for dividends
Common stock 130,915,121 shares 130,847,899 shares
Preferred stock 19,853,734 shares 19,853,734 shares
Dividend rate
Common stock 276% 150%
Preferred stock 277% 151%
Dividend amount
Common stock ₩1,806,629 ₩981,359
Preferred stock 274,974 149,896
Total ₩2,081,603 ₩1,131,255
(C) Dividend payout ratio
2013 2012
Dividend payout ratio 7.2% 5.2%
(D) Dividend yield ratio
2013 2012
Common Stock Preferred Stock Common Stock Preferred Stock
Dividend yield ratio (*) 1.0% 1.4% 0.5% 1.0%
(*) The average closing price for a week before 2 trading days prior to dividend date.
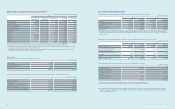
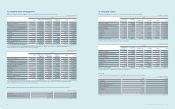
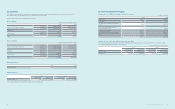
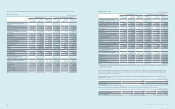
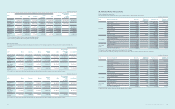
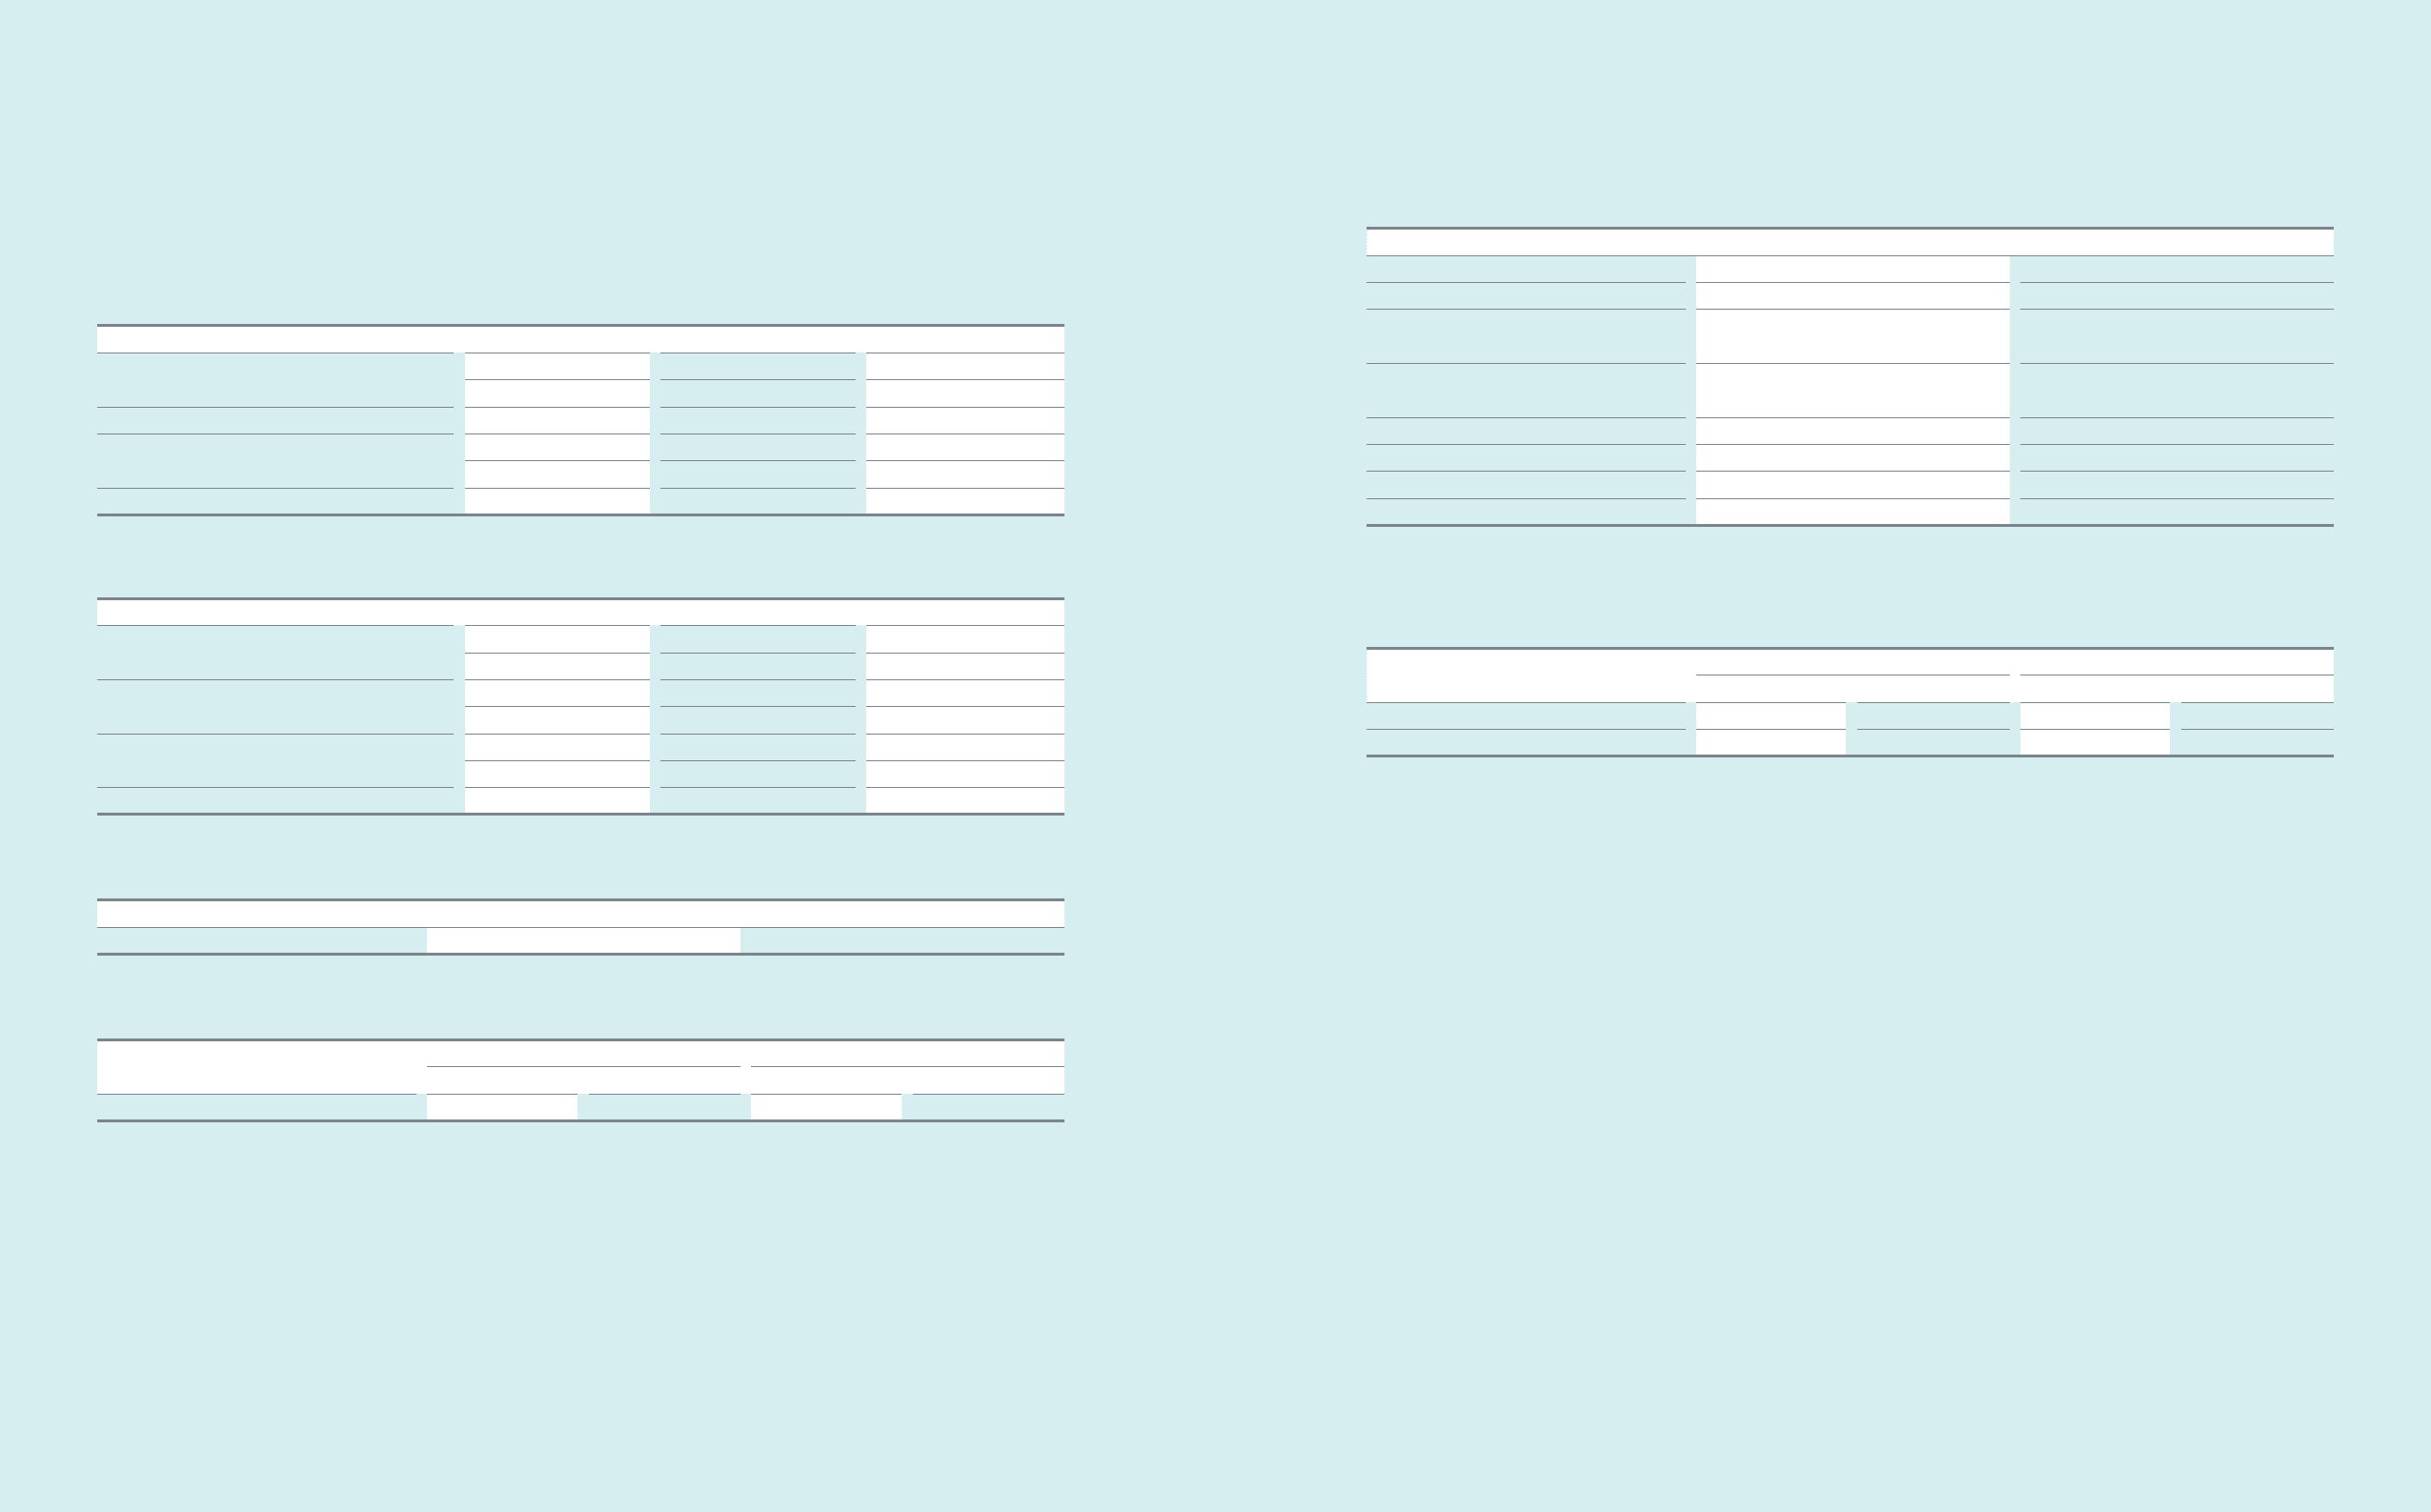
23. Other Components of Equity
(A) Other components of equity as of December 31, 2013 and 2012, consist of:
(In millions of Korean won)
2013 2012
Treasury stock (7,323,432) (7,350,927)
Stock options 10,243 22,242
Unrealized gains on available-for-sale nancial
assets 2,189,013 2,001,536
Share of other comprehensive income of
associates and joint ventures 741,893 720,944
Foreign currency translation (3,610,654) (2,623,963)
Remeasurement of net dened benet liabilities (1,302,588) (1,097,228)
Others (163,548) 134,352
(9,459,073) (8,193,044)
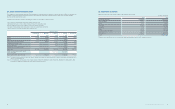
(B) Details of treasury stock as of December 31, 2013 and 2012, are as follows:
The Company repurchases registered common stock and non-voting preferred stock, and recognizes the repurchase amount in other components of equity.
Such stock will be distributed upon exercise of stock options, etc.
(In millions of Korean won and number of shares)
2013 2012
Preferred Stock Common Stock Preferred Stock Common Stock
Number of shares 2,979,693 shares 16,384,216 shares 2,979,693 shares 16,451,438 shares
Acquisition cost ₩621,843 ₩6,701,589 ₩621,843 ₩6,729,084