Samsung 2013 Annual Report Download - page 51
Download and view the complete annual report
Please find page 51 of the 2013 Samsung annual report below. You can navigate through the pages in the report by either clicking on the pages listed below, or by using the keyword search tool below to find specific information within the annual report.
98 99
2013 SAMSUNG ELECTRONICS ANNUAL REPORT
(B) Credit risk
Credit risk arises during the normal course of transactions and investing activities where clients or other parties fail to discharge an obligation. The Company
monitors and sets the client’s and counterparty’s credit limit on a periodic basis based on the client’s and counterparty’s nancial conditions, default history and
other important factors.
Credit risk can arise from transactions with nancial institutions which include nancial instrument transactions such as cash and cash equivalents, savings,
and derivative instruments. To minimize such risk, the Company transacts only with banks which have strong international credit rating (S&P A and above),
and all new transactions with nancial institutions with no prior transaction history are approved, managed and monitored by the Company’s nance team and
the local nance center. The Company requires separate approval for contracts with restrictions.
Most of the Company’s accounts receivable is adequately insured to manage any risk, therefore, the Company estimates its credit risk exposure to be limited.
The Company estimates that its maximum exposure to credit risk is the carrying value of its nancial assets, net of impairment losses.
(C) Liquidity risk
Due to large investments made by the Company, maintaining adequate levels of liquidity risk is critical. The Company strives to achieve this goal by periodically
forecasting its capital balance, estimating required cash levels, and managing income and expenses.
The Company manages its liquidity risk by periodically forecasting projected cash ows. If abnormal signs are identied, the Company works with the local nance
center and provides liquidity support by utilizing a globally integrated nance structure, such as Cash Pooling. In addition, the Company maintains
a liquidity management process which provides additional nancial support by the local nance center and the Company. The Cash Pooling program allows
sharing of surplus funds among entities and contributes to minimizing liquidity risk and strengthening the Company’s competitive position by reducing capital
operation expenses and nance expenses.
In addition, the Company mitigates liquidity risk by contracting with nancial institutions with respect to bank overdrafts and foreign trade nance and by providing
payment guarantees to subsidiaries. For large scale facility investments, liquidity risk is minimized by utilizing internal reserves and long term borrowings according
to the capital injection schedule.
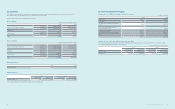
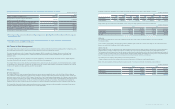
The following table is an undiscounted cash ow analysis for nancial liabilities that are presented on the statements of nancial position according to their
remaining contractual maturity.
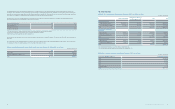
(In millions of Korean won)
2013 Less than 3 months 4-6 months 7-12 months 1-5 years More than 5 years
Financial liabilities ₩33,862,896 ₩1,095,285 ₩4,806,477 ₩2,564,769 ₩65,772
(In millions of Korean won)
2012 Less than 3 months 4-6 months 7-12 months 1-5 years More than 5 years
Financial liabilities ₩32,257,940 ₩1,690,825 ₩2,371,879 ₩7,006,975 ₩76,236
The Company’s trading portfolio of derivative instruments have been included at their fair value of ₩244,172 million (2012: ₩79,212 million) within the less than
three month time bucket because the contractual maturities are not essential for an understanding of the timing of the cash ows. These contracts are managed
on a net-fair value basis rather than by maturity date. Net settled derivatives consist of forward exchange contracts used by the Company to manage
the exchange rate prole.
The maximum liquidity risk exposure from those other than the above nancial liabilities (e.g. payment guarantees for afliated companies and performance bonds)
as of December 31, 2013 is ₩183,644 million (December 31, 2012: ₩151,817 million).
(D) Capital risk management
The purpose of capital management is to maintain a sound capital structure. The Company monitors capital on the basis of the ratio of total liabilities to total
equity. This ratio is calculated by dividing total liabilities by total equity in the consolidated nancial statements.
The Company’s capital risk management policy has not changed since the scal year ended December 31, 2012. The Company has maintained an A+ and A1
credit ratings from S&P and Moody’s, respectively, on its long term debt.
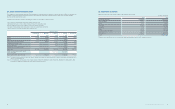
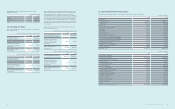
The total liabilities to equity ratios as of December 31, 2013 and 2012, are as follows:
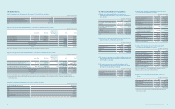
(In millions of Korean won)
2013 2012
Total liabilities ₩64,059,008 ₩59,591,364
Total equity 150,016,010 121,480,206
Total liabilities to equity ratio 42.7% 49.1%
(E) Fair value measurement
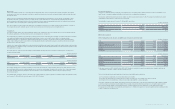
(1) The following table presents the assets and liabilities, by level, that are measured at fair value:
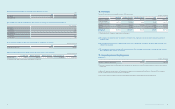
(In millions of Korean won)
2013 Level 1 Level 2 Level 3 Total balance
Derivatives ₩ -₩40,552 ₩ -₩40,552
Available-for-sale nancial assets (*) 5,656,806 1,188,498 493,378 7,338,682
Total assets 5,656,806 1,229,050 493,378 7,379,234
Derivatives - 244,172 - 244,172
Total liabilities ₩ - 244,172 ₩ -₩244,172
(In millions of Korean won)
2012 Level 1 Level 2 Level 3 Total balance
Derivatives ₩ -₩47,227 ₩ -₩47,227
Available-for-sale nancial assets (*) 5,694,730 125,994 389,195 6,209,919
Total assets 5,694,730 173,221 389,195 6,257,146
Derivatives - 79,212 - 79,212
Total liabilities ₩ -₩79,212 ₩ -₩79,212
(*) Amount measured at cost (2013: ₩388,225 million, 2012: ₩278,130 million) is excluded as the range of reasonable fair value estimates is signicant and
the probabilities of the various estimates cannot be reasonably assessed.
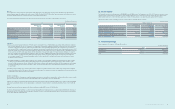
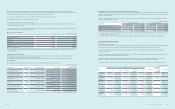
The levels of the fair value hierarchy and its application to nancial assets and liabilities are described below.
· Level 1: Quoted prices (unadjusted) in active markets for identical assets or liabilities
· Level 2: Inputs other than quoted prices included within Level 1 that are observable for the asset or liability, either directly or indirectly
· Level 3: Inputs for the asset or liability that are not based on observable market data (that is, unobservable inputs)
The fair value of nancial instruments traded in active markets is based on quoted market prices at the statement of nancial position date. A market is regarded
as active if quoted prices are readily and regularly available from an exchange, dealer, broker, industry group, pricing service, or regulatory agency, and those
prices represent actual and regularly occurring market transactions on an arm’s length basis. The quoted market price used for nancial assets held by
the Company is the current bid price. These instruments are included in Level 1. Instruments included in Level 1 are listed equity investments classied as trading
securities or available-for-sale nancial assets.


