Samsung 2013 Annual Report Download - page 41
Download and view the complete annual report
Please find page 41 of the 2013 Samsung annual report below. You can navigate through the pages in the report by either clicking on the pages listed below, or by using the keyword search tool below to find specific information within the annual report.
78 79
2013 SAMSUNG ELECTRONICS ANNUAL REPORT
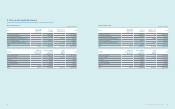
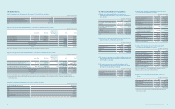
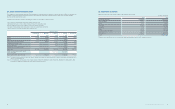
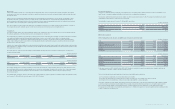
15. Borrowings
(A) Details of the carrying amounts of borrowings as of December 31, 2013 and 2012, are as follows:
(In millions of Korean won)
Financial Institutions Annual Interest Rates (%)
as of December 31, 2013 2013 2013
Short-term borrowings
Collateralized borrowings (*1) Woori Bank, etc. 0.6~11.7 ₩3,256,935 ₩4,328,503
Non-collateralized borrowings Citi Bank, etc. 0.6~19.0 3,181,582 4,115,249
Total ₩6,438,517 ₩8,443,752
Current portion of long-term
borrowings
Bank borrowings SMBC, etc. 1.3~7.4 ₩1,900,937 ₩480,567
Financial lease liabilities (*2) CSSD, etc. 1.1~15.7 19,811 13,293
Total ₩1,920,748 ₩493,860
Long-term borrowings
Bank borrowings SMBC, etc. 0.7~5.3 ₩902,715 ₩3,521,257
Financial lease liabilities (*2) CSSD, etc. 1.1~15.7 82,402 101,771
Total ₩985,117 ₩3,623,028
(*1) Collateralized borrowings are secured by trade receivables (Note 8).
(*2) Leased property, plant and equipment were pledged as collateral (Note 19).
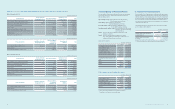
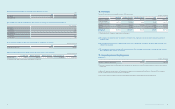
(B) Maturities of long-term borrowings outstanding as of December 31, 2013, are as follows:
(In millions of Korean won)
For the Years Ending December 31 Long-term borrowings
2014 ₩1,920,748
2015 356,455
2016 559,624
2017 7,248
2018 and thereafter 61,790
Total ₩2,905,865
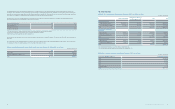
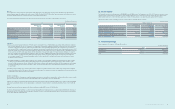
Goodwill impairment reviews are undertaken annually, and the recoverable amounts of cash-generating units have been determined based on value-in-use
calculations. These calculations use pre-tax cash ow projections based on nancial budgets approved by management covering a ve-year period. Cash ows
beyond the ve-year period are extrapolated using the estimated growth rates stated below. The growth rate does not exceed the long-term average growth rate
for the business. In addition, a constant growth rate assumption is used for perpetual cash ow calculation.
Pursuant to the results of the goodwill impairment reviews performed, the Company recognized an impairment of goodwill for the Digital Imaging business.
The major assumptions used in calculating the value in use are as follows:
Samsung Digital Imaging 2013 2012
Sales growth rate (*1) 0.2 6.7
Perpetual growth rate (*2) (4.1) (2.4)
Pre-tax discount rate (*3) 13.0 15.6
(*1) Future cash ows for 5 years are projected based on previous growth rate and the industry estimates.
(*2) The projected growth rate beyond ve years is consistent with industry estimates.
(*3) Pre-tax discount rate applied to the cash ow projections.
Sales growth rate was determined on the basis of past performance and expectations of market uctuations. The discount rate reects the special risk related to
the division.
The carrying value of Samsung Digital Imaging exceeded the value in use by ₩82,599 million in 2013 and ₩204,600 million in 2012 and the amounts have been
recognized as the other non-operating expenses in the consolidated statements of income.
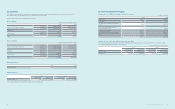
(C) Details of amortization of intangible assets by line item for the years ended December 31, 2013 and 2012, are as follows:
(In millions of Korean won)
2013 2012
Cost of sales ₩418,447 ₩327,869
Selling and administrative expenses, etc. 556,954 459,101
Total ₩975,401 ₩786,970


